
Google is one of the biggest companies in the world, reaching billions of internet users through its products, every single day. In its recent earnings call, CEO Sundar Pichai announced that Play Store has become the sixth Google product to be used by more than a billion people.
Google is known for its collection of wildly popular products, from Search to Maps to Android. But not everything the company touches turns to gold.
Google even kills so many of its products!
How does a company decide such actions?
BCG matrix is a framework that helps them in doing so. So that a firm can plan accordingly where to invest, diverse or kill products.
So before making a BCG matrix of Google, let’s see what is a BCG matrix.
What is BCG Matrix?
BCG (Boston Consulting Group) matrix is a simple strategic planning tool that can aid companies in reviewing their brand competitive positions. This also assists in making key decisions such as whether to develop a certain business unit, sell the same, discontinue or increase investment.
This tool works for firms with diversified product lines, hence suitable for Google. It finally divides the products into four categories- Dogs, Cash Cows, and Question Marks.
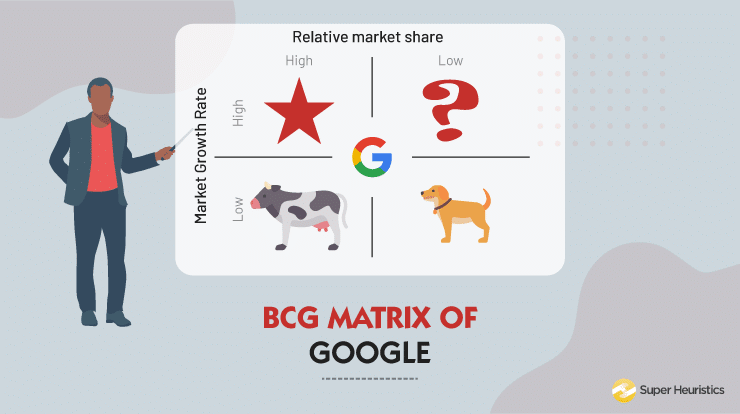
I have a diagram for you to understand how this matrix is formed.

The model assumes that one of the main indicators for cash generation is relative market share, whereas the indicator for cash usage is the projected market growth rate.
Going into a little more depth about the matrix, let’s continue!
The Axes
In mathematical terms,
Relative Market Share (%) = Brand’s Market Share ÷ Largest competitor’s market share
You use “next largest competitor’s data”, in case your firm is the largest one.
Relative market share allows companies (and their investors) to see how they're faring in terms of their largest competitors. So, they can make strategic decisions to increase sales.
But in the industry, the value usually ranges from 0.1 to 4. And the division happens at ~1 value.
We don’t use it beyond that! Because a value of “4” tells us that your brand’s market share is way ahead of your next rival. And probably already dominates the existing market.
Similarly, for market growth rate;
Value ranges from 0%- 30%. And the division takes place at 10-15% value.
We can see here that the axis is not linear in nature. Rather they are logarithmic scales!
If you can get some data of for this matrix, do try to solve it on Excel. For that I suggest, you follow the following link!
BCG MATRIX: CONSTRUCTION AND ANALYSIS IN EXCEL WITH EXAMPLE
By now you understood how the BCG matrix of drawn. Now lets see what the 4 broad categories are, and how are they interpreted by business.
The Categories
Each of the four quadrants represents a specific combination of relative market share, and growth:
Low Growth, High Share: Firms should milk these “cash cows” for cash to reinvest.
High Growth, High Share: Firms must invest in these “stars” as they have high future potential.
High Growth, Low Share: Firms should invest in or discard these “question marks,” depending on their chances of becoming stars.
Low Share, Low Growth: Firms should liquidate, divest, or reposition these “pets.”
For a better understanding of the quadrants,
Do Read: BCG Matrix of ITC
Now coming to the interesting part! How to use this to analyze Google’s business. What products are dogs of Google, stars of Google, and etc.
BCG Matrix of Google
Before jumping into the BCG matrix building for Google, let’s check out Google’s product portfolio.
You may think of Google as a Web search company.
Google CEO Sundar Pichai does not. He thinks of Google as a technology company. He believes Google's mission is to identify human problems than can be solved with technology and then come up with the technologies that solve those problems.
That’s a quite broad mission to follow.
But if not Google, then who can achieve it?
Product Portfolio
Anyway, how many Google products and services do you use? The common answers will be Gmail, Google Drive, Google Maps, Google Chrome, YouTube, or an Android. But Google is well beyond that.
Would you believe Google has about 250+ products and services? In fact, even Google’s own products page is not listing all their products.

Source: Google Products List
For an easy approach, I have categorized the plethora of products into few categories:
1- Web-based:
Under this category you can find Google’s search engine. For which it has a pseudo-monopoly. Apart from that, it also has other search tools, advertising services, communication and publishing tools etc.
Even statistical tools like Google Analytics comes under this.
2- Developer Tools:
Even for software developers, it has a lot of applications for different platforms. Like Google Developers, Gerrit, Google Web Toolkit, etc. Along with-it Google also has different set of security tools to prevent bot breaches.
3- Operating Systems:
One of our favourites “Android”- this Linux based operating system is a product of Google. And similarly, for desktops it has the Chrome OS for us.
4- Desktop/Mobile Applications:
You must be familiar with a ton of mobile applications of Google. Here is an exclusive list of active and discontinued applications that Google offered for mobile.
List of Android Apps by Google
For desktops it has options like Google Earth, AdWords Editor, etc.
5- Services and Hardware:
Google is investing heavily in the cloud-based services sector. And we all are quite familiar with its hardware products too. The Nexus/Pixel products are an example of that. These products are growing at a healthy pace and even competing well across the mobile industry.
Now coming to the BCG Matrix example of Google. Here I have categorized the above segments into BCG Matrix. You can also do it product wise, or even department wise!
Without further ado, let’s begin!
BCG Matrix Analysis of Google
Analyzing the expected growth rate and the relative market rate will give us the preliminary information for our BCG matrix. As the number of products is huge, for simplicity's sake, I have taken few examples per category.
Let's have a look at our BCG Matrix analysis of Google.

Cash Cow Products
Google’s advertising business is a revenue cash cow. Google's ads advertisements integration touches almost all of Google’s web properties.
Any recommended websites you see when logged into Gmail, YouTube, Google Maps, and other Google sites are generated through the advertising platform.
And when it comes to Google Search Engine, around 70% of the world population uses it. Thus, making it dominant in the relative market share.
Android and Chrome OS are again some of the people’s favourite. Google's Chrome browser is also among the few products used by a billion people worldwide. Available on desktop as well as mobile devices, it is the browser of choice for many people: across all platforms, it has a market share of 45%.
Star Products
Now these are the ones which are fast-growing market leaders. And usually they generate largest profits but needs a lot of cash to finance too.
Here we can put Google Maps. It is the default online mapping solution for many, also has over 1 billion users, thus making it among the widely used online products globally. But requires a lot of innovations and updates on Google’s end to be user’s favourite!
Similarly, YouTube is a star product too. Did you know more than 500 hours of content gets uploaded on YouTube every minute? The growth and expansion touch the sky for this one.
With the onset of smart ecosystem, Google’s Assistant has also become one of the big players.
Question mark Products
Google Drive and Docs are an example of this. The demand for data storage and protection increased the cloud storage market.
Google Drive and Docs have potential and high market growth but faces less money return due to their competitor's high market share. In this case its Microsoft’s products.
Hence, it is placed in the problem child category.
Google can increase its market share in this product and push them to star category or else it will start depreciating.
Dog Products
The product has very less market growth and very less profit. Basically, it is an inactive investment. Either you can modify the product to retarget in different markets or eliminate the product after selling out.
For Google, it killed some of the dog-products because they acted merely as cash-traps. For example, Google Video player.
Now it wasn’t a total failure, idea wise. Google Video launched in late January 2005 and 22 months later Google bought YouTube for $1.65 billion. And now you an find every video on YouTube, hence Google video player failed to get income.
Google Glass might be another example. Even though it was high on innovation scale and definitely took some serious cash resources, it still got pulled out. Some say it was a product whose “target problem” wasn’t chalked out properly.
To know more read: The Case for Google Glass: Finding Success Through Failure
Google Plus was another such failure which couldn’t keep up with the competition.
After classifying the Google's SBUs in the Matrix, and obtaining the BCG matrix of Google, the next step is to allocate future resources to these SBUs to ensure the long-term growth of Google. Let take a look at how it is done.
How to use BCG Matrix?
The BCG matrix of Google, helps the businesses management to understand where each of their products stands and allows them to evaluate these objectively. There are a handful of potential strategies that a business can follow based on the results of their matrix analysis. These include:
Build – Increase investment in a product in order to increase market share (e.g. to push a Question Mark product into a Star.)
Hold – Hold a product in its current quadrant if a business cannot afford to invest further
Harvest – Reduce investment in order to take out the maximum cash flow from a product (e.g. when trying to increase the profitability of a Cash Cow).
Divest – Release the amount of money trapped in the business (e.g. terminate the production of a Dog product)
So, that’s how any firm reaches a conclusion about a product.
Conclusion
In conclusion we learnt why companies need a BCG matrix and what it is. Why it's such an essential tool for marketers.
I created The BCG Matrix of Google, keeping its broad product portfolio in mind. And identified the Matrix's various components, namely- Star, Cash Cow, Question Mark and Dog
The article took examples for each quadrant- mostly of apps that you would be familiar with. The examples were designed to explain how different product bring different profits.
And lastly, how does this help a marketer to decide upon the actions needed.
Hope this article helped you!


Thanks for this fluent and excellent article
This article was very descriptive, informative and helpful. Thanks a lot from a fellow student.