GE Matrix or McKinsey Matrix or GE-McKinsey Matrix. All of them are the names of this strategy tool that helps you analyze your product portfolio.
“Between calculated risk and reckless decision making lies the line between profit and loss”
The GE Matrix fits perfectly in the analysis of the product portfolios of a company.
For a company earning profits from just one source or one product is risky. Therefore, new product development or diversification is the only way out.
On that note, just consider a massive giant like Unilever. You will be astonished to see the diversification in their product portfolio. Have a look!

Source: World's leading Companies
To simultaneously keep a check on these diverse brands and take decisions according to their performance, it is imperative to use a systematic framework like a GE Matrix.
As I write this piece in October 2018, I am working on a consulting assignment in Singapore for one of the top American pharmaceutical companies.
They have a large product portfolio spanning across various therapeutic specialties.
My interaction with the marketing managers and the sales team led me to the understanding that the government ordering of medicines happens through tenders.
One of their high performing products (by sales) does good numbers only when it bags the government tender for that year. Otherwise, for the private market, it sells like a commodity with a lot of competition and generic drugs eating into their market.
The assignment that I have includes working on this product and making it a strong part of the portfolio. The objective is to make it do well in the private market as well.
For them, the idea is to move away from the instability that this product brings to their balance sheet every other year when they win or lose the government tender.
And that makes perfect sense as per the portfolio effect. You tend to diversify or spread your risks across products and business units.
The GE Matrix helps you identify the performance of the products in your product portfolio.
What Exactly is the GE Matrix?
The GE matrix is a 9-box matrix which helps corporations to evaluate their business portfolios and prioritize investments among their diversified units in a systematic manner.
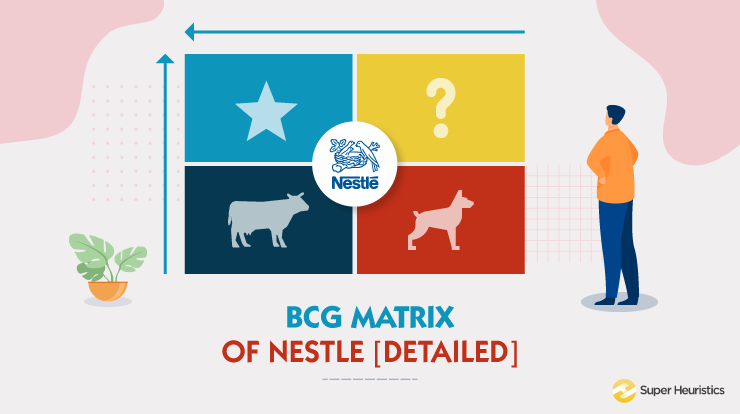
You would have heard about the Boston Consulting Group Matrix popularly known as the BCG matrix. GE Matrix is an extension and an improved version of it.
In case you need a thorough understanding of the BCG Matrix, here are a few examples from some of our blogs:
Also Read: The BCG Matrix – What is it and how to use it
The businesses now are becoming more and more vulnerable and dynamic.
They are more focused on their investment which gives maximum results, this matrix ensures the company to analyse in a more systematic and precise manner.

Rather than relying on future projections of business unit, the company can make a systematic decision taking two factors into consideration: the attractiveness of the relevant industry and the competitive strength of the unit within its industry.
The GE matrix is of 3X3, where Y-axis measures the attractiveness of the market and X-axis measures the strength of the business unit.
If you are wondering how to go about classifying products in these two categories, lets have a look at the two terms in detail.
Market attractiveness
Market attractiveness talks about the perks the potential market holds for the company. Therefore, before diversification, a company has to check certain components of the market. These include the following:
a) Size of the market
b) Structure of the industry
c) Competitors
d) Entry and exit barriers
e) Product life cycle
f) Demand
Example for Market Attractiveness
To understand this better, we’ll consider the market attractiveness component for Reliance Retail from GE Matrix of Reliance.
Reliance Group, led by Dhirubhai Ambani, started back in 1966 and was mainly functioning in the infrastructure, power and communications sector. In 2006, the company took a when they started Reliance Fresh.
Now, why is it that from selling electricity and gadgets Reliance directly came down to selling potatoes and tomatoes?
Are these decisions taken by marketers just out of the blue?
Well, a study of 33 markets across the country has analysed that the retailers of the vegetables and dairy items are selling at a profit of 48.8% than the wholesale prices.
India is one of the top 5 retail markets in the world and retail trade holds about 10% of our GDP.
Reliance Fresh, which now has about 700 outlets in the 93 cities, has been tapping the potential retail market of the country.
It even plans to invest 3.5 billion dollars in the coming years to optimize their operations.
Business strength
Every business has to run along with its competitors. Along with that, it needs to capitalize on its core competencies to create a sustainable advantage.
Internal as well as external factors help the company to define their position in a competitive setup.
Internal factors – product differentiation, the company’s market share, assets, R & D services, customer loyalty programmes etc.
External factors – Competitors, Government regulations, the economic condition of the market, external parts of the value chain.
Example for Business Strength
How many of us remember Foodle?
For the many who may not remember, it was a brand extension of Horlicks, back in 2010.
The company launched the product with an idea of making a healthy alternative to Maggi noodles.But despite aggressive marketing and promotions, the brand still couldn’t gather a considerable market share.

It faced a tough competition from the already existing brand – Maggi, more specifically from Maggi Atta noodles. How often would companies be able to survive when the market is dominated by certain brands already.
As it turned out, It was not only an unsuccessful brand extension but it also hampered the profitability of Horlicks.
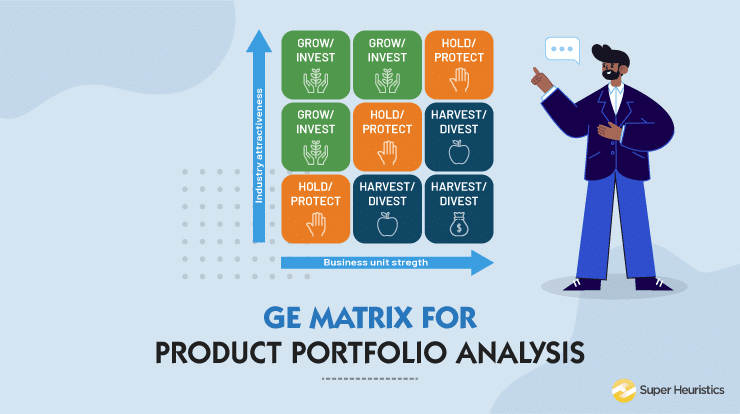
What can we Infer from the GE Matrix?
As you could see from the GE matrix given in the image above, you would identify and label each product and the business unit which you are evaluating.
In GE Matrix these labels are Growth, Selectivity,and Harvest, Below, I would explain each of these labels and what does it mean for the company that falls under that category.
Also Read: Important Frameworks for Marketers
Growth in GE Matrix
As the name suggests, the business units that fall in this category are products which will be giving higher returns in the near future.
So the investments required here are more in R & D, promotions, advertisements etc.
Selectivity in GE Matrix
It is quite similar to the question mark product of the BCG matrix, wherein the state of the product is still in ambiguity. However as uncertainty prevails and as business units are always going to be risky, the final decision is made by the management which is in line with their vision.
Harvest in GE Matrix
This category is similar to the dog products of the BCG matrix. Herein, the products are not going to reap the desired profits and are likely to fail.
Investing in such products will be an in-elevation risk for any organization.
Each box in the GE Matrix can be attributed a particular decision that can be taken by the parent company.

How to Build a GE-Mckinsey Matrix?
The GE matrix for any company can be developed by following these simple steps:
Step1: Determine Market attractiveness of each of the business units
In order to determine the industry attractiveness, first shortlist the factors that will determine the attractiveness of the Industry. We have discussed them in this blog, so you can refer some of those factors.
After you have decided the factors, rate each factor based on its importance in determining the industry attractiveness. For example, if market share is one of the factors and you consider it to be the most important factor, give it maximum weightage of let’s say 30%.
Give each of your product a score out of 10 based on the factors that you have listed.
Calculate the weighted average by considering both the weightage of the factor itself and the score given to each business unit.
Step2: Determine Competitive Strength of each of the business units
Again, follow a similar methodology of making a list of factors and then assigning them weightage according to their importance.
Rate all business units out of 10 on these factors and then calculate a weighted score.
Step3: Analyse the information and Place them on the GE Matrix
According to the weighted scores of each business unit in terms of market attractiveness and competitive strength, plot them on the matrix.
Step4: Take decisions accordingly
Prioritise your further course of action based on the location of business unit on the GE matrix.
If you found this confusing, I have you covered because we’ll now be performing all these steps with GE Matrix example.
GE Matrix of Reliance
I thought it would make more sense if analysed GE Matrix with Indian Example. So, lets consider one of the most influential Indian firms for our GE Matrix example- Reliance.
Reliance Product portfolio includes its services in the Petroleum and Natural Gas sector, Petrochemicals, Textiles, Retail, Telecommunication, Entertainment, Financial Services and software.
For our analysis, let’s select a group of 5 business units from these sectors that Reliance operates in:
Jio Communication
Vimal
Reliance Fresh
Jio Money
Colors
Step1: Analysing the Market Attractiveness

(Data used may not be accurate. Used just for calculation example purposes)
Step2: Analysis of Competitive Strength

(Data used may not be accurate. Used just for calculation example purposes)
Step3: Plot the Matrix

Step4: Conclusion from the GE Matrix
As per the GE Matrix, all 5 business units fall in the category of Invest and grow. The company should be focussing on all these businesses in the coming years as per our conclusion.
Conclusion
As every tool or framework has its pros of being a great aid in the decision-making process, it has its limitations as well.
While the GE Matrix helps a marketer in taking product portfolio investment decisions, it has its limitations too!
One of those limitations is that the potential synergy and the undercurrents between two business units of the similar organisations are not considered.
Which means that at times certain businesses are run or certain products are maintained because they help in accentuating the other business or product. And therefore, killing this product or thinking of the other product to be the strong product is misleading.
Despite, those small nuances, the GE matrix is still one of the best management tools for the marketers.