There is something about predictions that fascinates us. Those who have even a little bit of familiarity with statistics would know that Linear Regression is probably the first thing you learn in the context of prediction.
In this article, I discuss Linear Regression as a method for sales forecasting (or for that matter, any forecasting).
And if you thought that Linear Regression is great, I will show you how Linear Regression is inaccurate and misleading in most of the circumstances.
In the first article in this series on How to do (accurate) Sales Forecasting, I gave you an overview of what sales forecasting is.
I also highlighted that why as a marketer it is your responsibility to do it (accurately) than it is of any salesperson.
Now, this article is about applying Linear Regression to the dataset that I shared with you in the last post.
But, before that, let me begin by quickly refreshing your memory about why Linear Regression is.
What is Linear Regression?
Linear Regression is a predictive analysis tool.
When applied to a given dataset the tool tells us two things:
- How well do the predictors explain the dependent variable?
- With what magnitude does each of the predictor variables impact the dependent variable
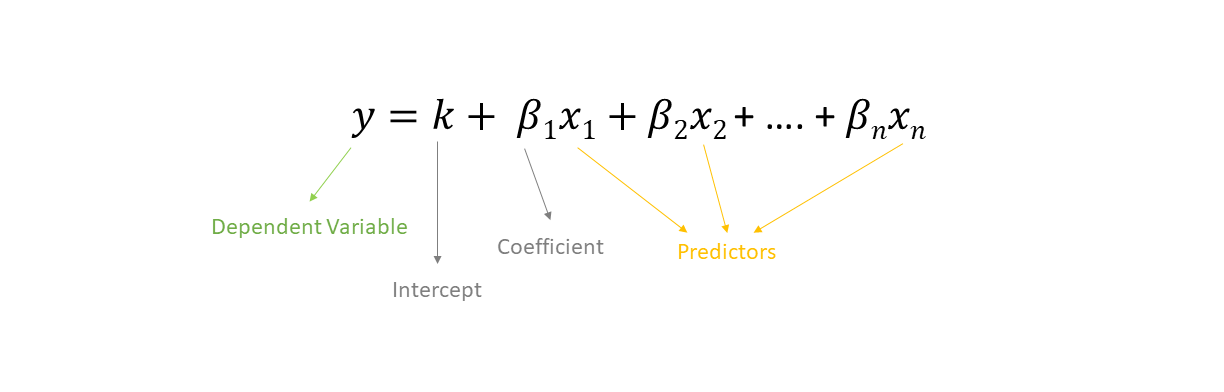
The simplest linear regression equation is this
How to perform Linear Regression
If you haven’t read the previous post in the series where I had shared the sample dataset, you may download the file from here.
I would again like to give credits to this dataset to my Marketing Analytics professor, Prof. Prantosh Banerjee.
He has spent years and years as an Analytics and Consumer Behaviour consultant in the industry. He is a PGDM from IIM Calcutta and has been teaching at a few IIMs across the country including mine.
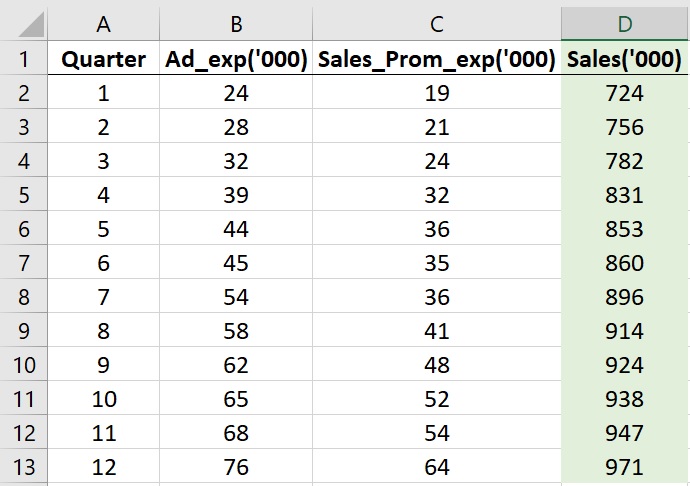
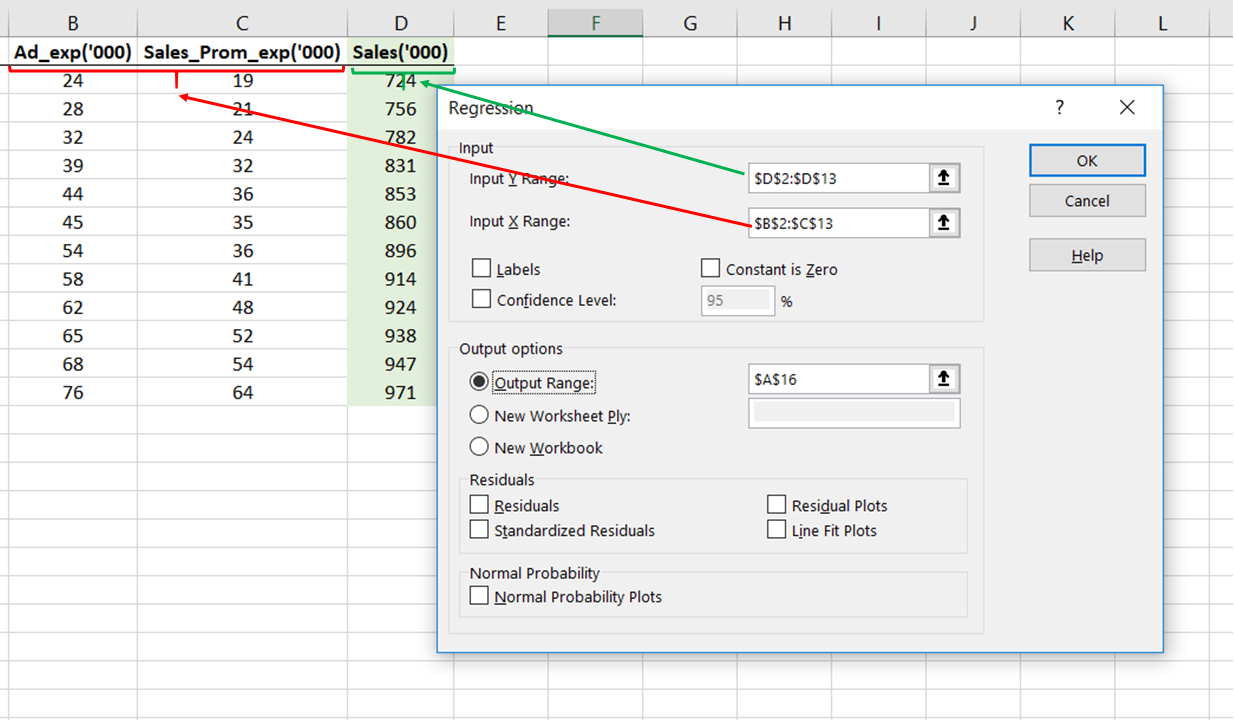
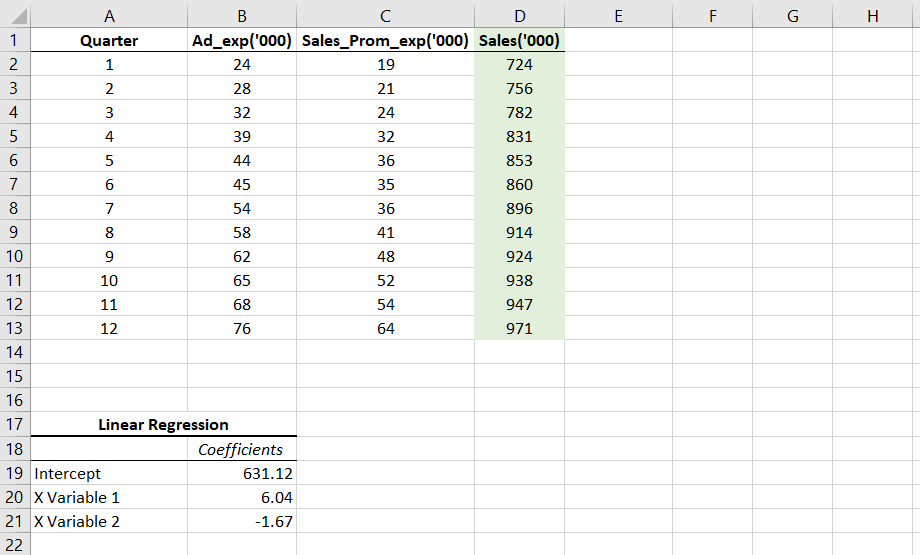
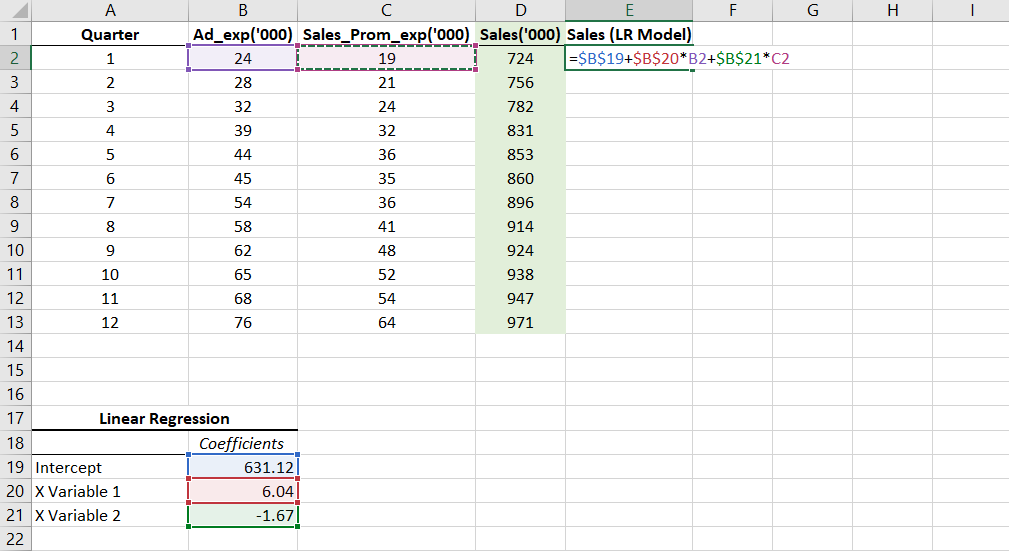
In the image below, you can see the snippet of the dataset with columns Ad_Exp and Sales_Prom_Exp as the predictor variables and the column Sales as the dependent variable.
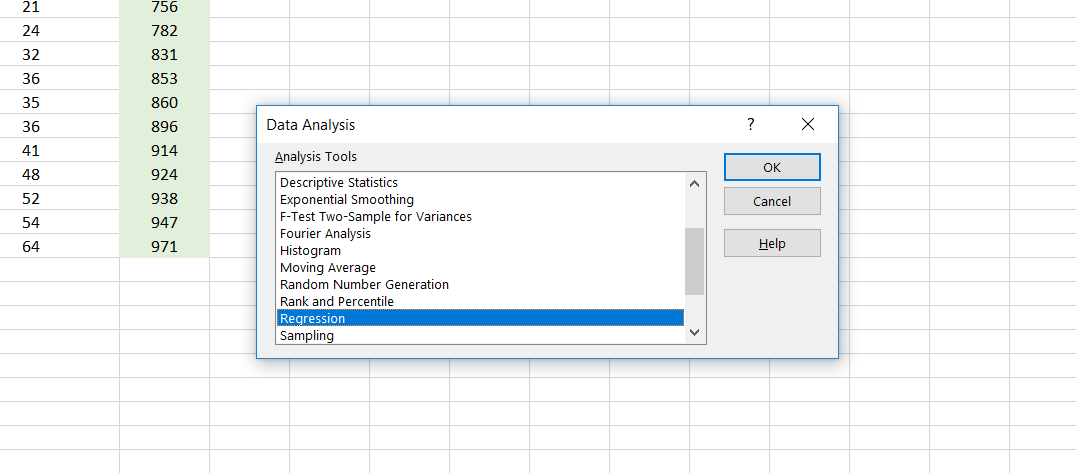
To perform Linear Regression in Excel go to the Data tab and then go to Data Analysis.
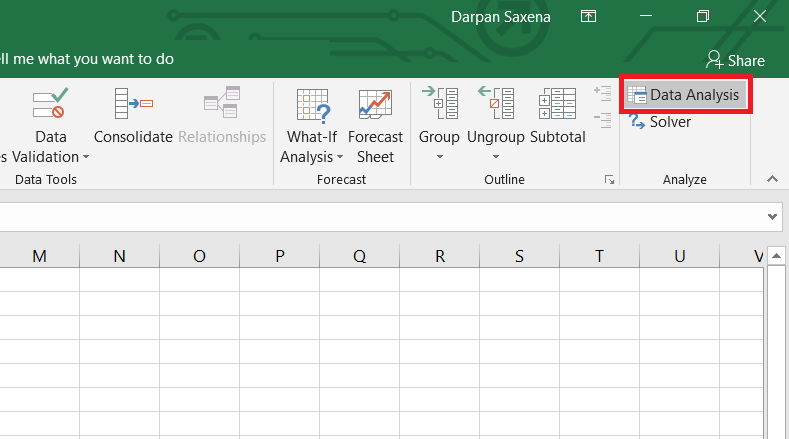
Select Regression from the menu that pops-up
Now, remember that we wish to see the relationship of both the predictors with the Sales.
Set up the Ad_Exp and Sales_Prom_Exp as the input X range and Sales as the input Y range as I did it in the image below.
This is in accordance with the linear regression equation that I showed you above where y was the dependent variable and x were the predictors.
Now, have faith in God and in yourself and click ‘OK’
What you will come across on your screen is the regression output. The interpretation of what each element of this output means is the subject matter for another blog post on what are the basics of regression.
Here, in the output focus on the ANOVA table and the intercepts mentioned below it. This one.
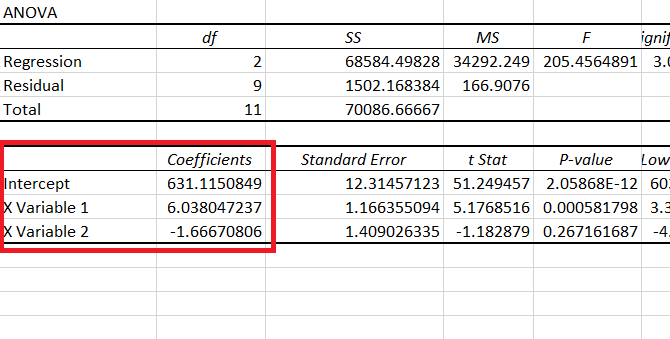
Here, remember that X Variable 1 is Ad_Exp and X Variable 2 is Sales_Prom_Exp (because that is the order in which they were in our dataset)
I copy and pasted those coefficients and intercept values below the data table and removed everything else that I got in the output.
This leaves us with the linear model which can be described by the equation:
Sales = 631.12 + 6.04*(Advertisement Exp.) – 1.67*(Sales Promotion)
Compare this with the standard linear regression equation and things will be clearer to you.
Let’s take a moment or two to understand what this means. Here are a few inferences that you can draw from this.
- The situation seems to be such that even with zero advertisements and zero sales promotion expenditure, the brand manager would see the sales of ₹6,31,120
- While advertisement expenditure has a positive impact on sales (positive coefficient), sales promotion happens to have a negative impact on sales.
Point 2 is a little difficult to digest, but then that is where data and its correct analysis comes in handy.
We can see that the coefficient of Sales promotion is negative, which means as the expenditure on Sales Promotion increases, I am losing out on sales – the sales are decreasing.
Re-checking the Linear model
Now, we reached the point where we got the formula of our regression model which was this:
Sales = 631.12 + 6.04*(Advertisement Exp.) – 1.67*(Sales Promotion)
I will now apply the same formula in the column next to the column with the actual sales data.
My intention is to input the Ad_Exp and Sales_Prom_Exp of each of the given quarters to sort of cross-check if the model is formed correctly or not.
Note: Please be careful of where you put the $ sign in the formula.
Further, drag the formula in the entire column E to compare the predicted and the actual sales. I rounded off the values to two decimal places.
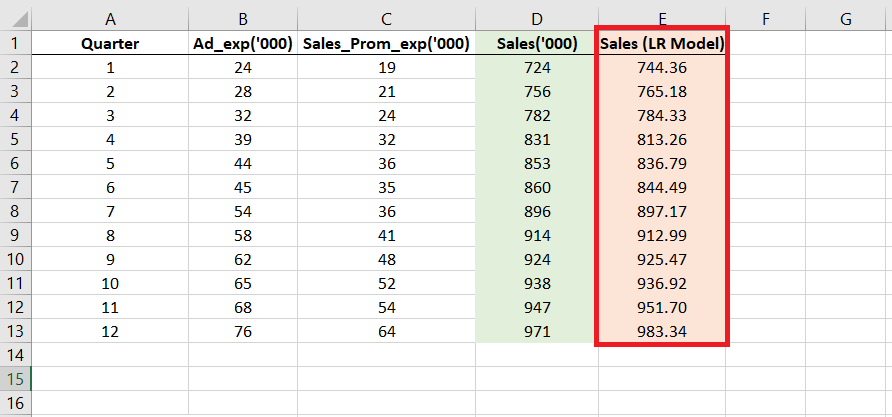
Our figures, each of them, seem close to the actual sales figures given in column D and therefore we can be sure of the at least the model has been correctly created.
How accurate is our model?
If you observe closely, you would realize that the accuracy is horrible.
To make the accuracy clearer to you, I calculated the difference between sales calculated from the LM model (E) and the actual sales (D) in column F.
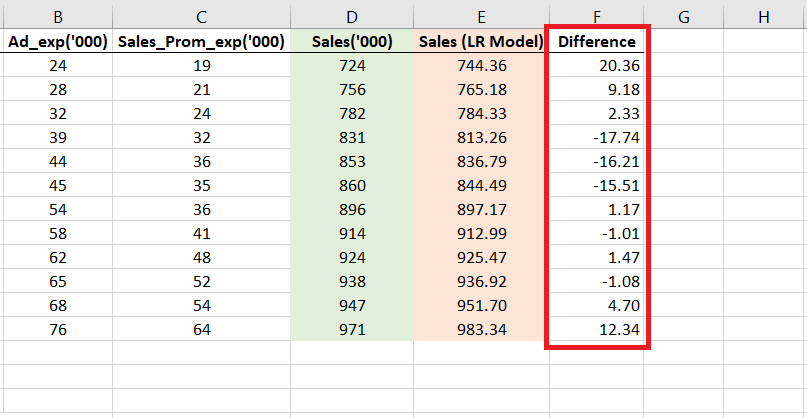
The difference is stark.
Right in the first quarter, you can see a difference of 20.36 which is ₹20,360!
This makes us think that was all this exercise of creating a predictive model worth it?
In fact, these results make us doubt that – can any prediction that this model makes for beyond the 12th quarter be trusted?
What if the error is even greater in that case?
These concerns and valid.
And chances are that the future predictions will be even more departed from the actual sales that might happen. This is because the model does not capture the true essence of the nature of the relationship.
And because it does not represent the relationship correctly, what are the chances that it will predict anything correctly?
Finally, what is wrong with Linear Regression?
The basic assumption in a linear regression model is – as the name suggests – linearity.
If we are performing a linear regression we are implying that a particular amount of increase in the advertisements leads to an equal (or equivalent) amount of increase or decrease in the actual sales.
But, is that always true? Is that always the best representation of the reality?
Let’s have a look.
Here is a scatter plot of the Ad_Exp with Sales
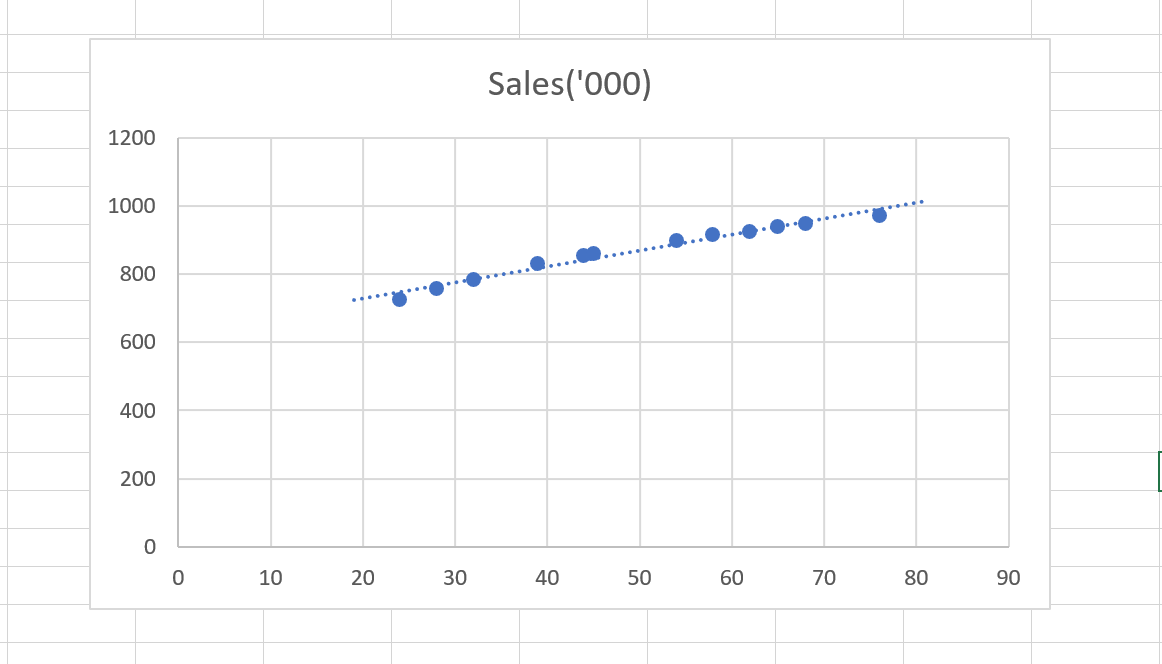
I added a trendline in the plot (the line that you see passing through the dots).
This trendline is a linear trendline, therefore, representing our linear regression model.
From the looks of it, it seems that it is close to all of our dots and represents the model perfectly.
But that impression lasts only once you try out other model types.
Before trying any other trendline, I checked the R² for the linear model.
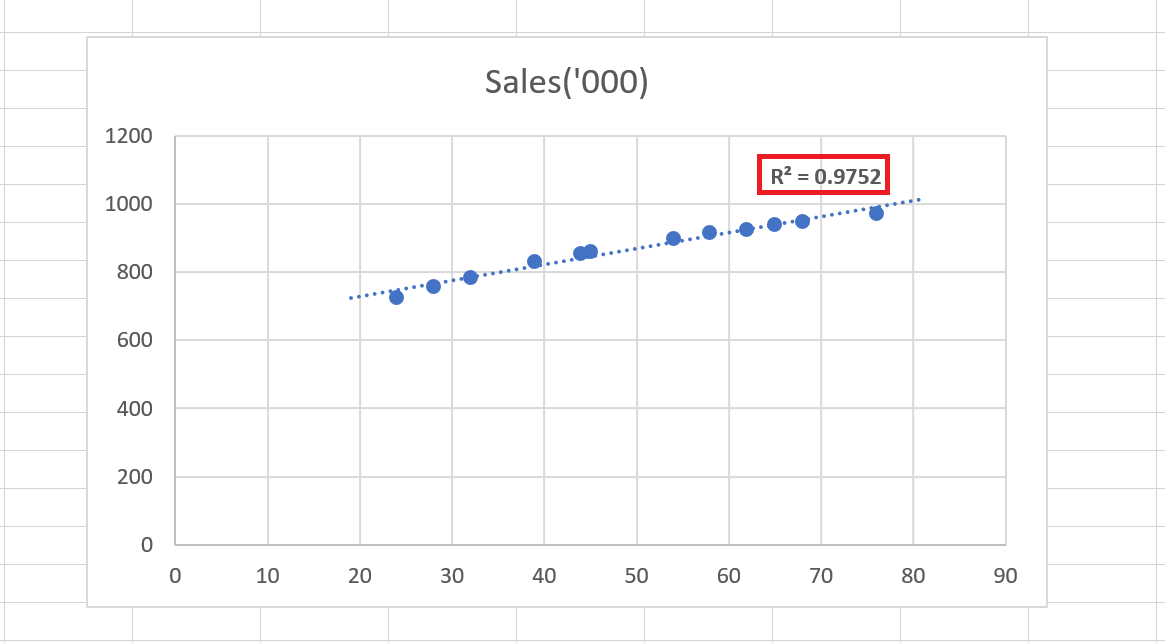
As we can see, the R² of the linear model is 0.975. Now, unless we find an R² higher than this, we can be sure that the linear model represents our data most accurately.
But as it turns out, just when I tried another model – the logarithmic model, I got an R² higher than 0.975
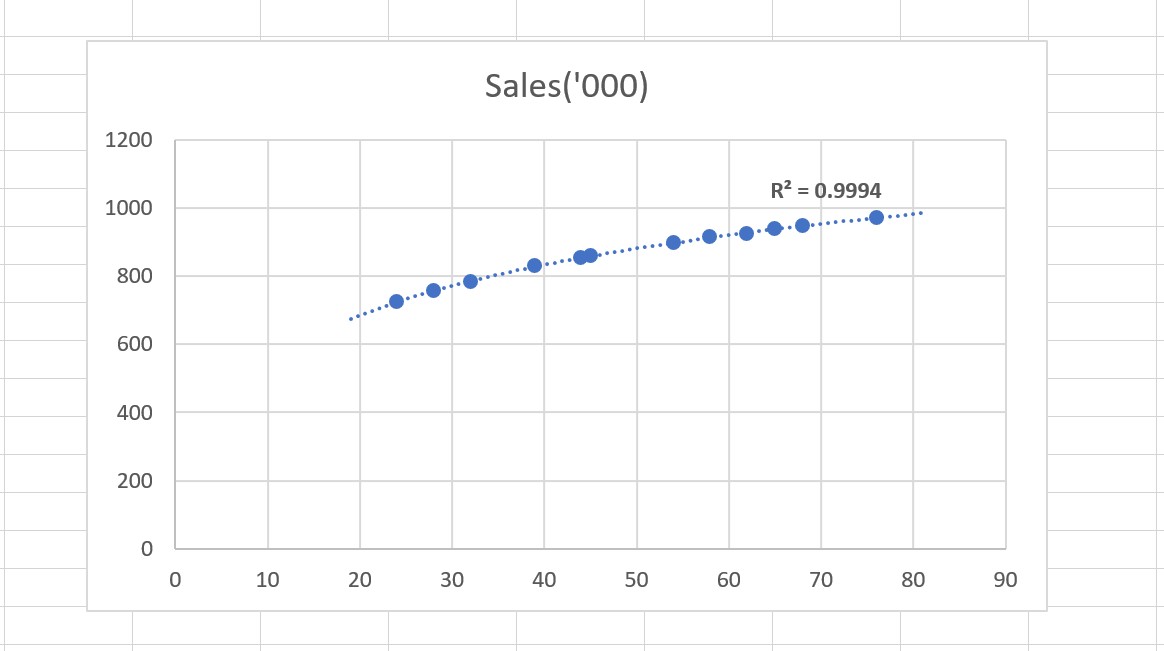
This is the logarithmic trendline (slightly curved if you can see), which gives us an R² of 0.9994. This is a near perfect R².
And this shows that a logarithmic model (which is non-linear) represents the Ad_Exp and Sales relationship much better than a linear model.
Therefore, this is why Linear Regression is a highly limited and inaccurate model in this case.
And that’s because it assumes that the relationship is linear.
What’s next?
We did say that the Logarithmic model better explains the relationship than the linear model. But are we sure that the logarithmic model explains it the best?
No. We can’t be sure of that unless and until we try each of the other models and check their R² value.
So far in these two blog posts of the series I have shared with you what is not to be done.
In the subsequent posts of this series, we will see how to find out the best model that will represent the predictors and variables.
Further, we will see how to create a final model that describes the relationship between all the predictors and the dependent variable. Accurately.
Let me know in the comments how you liked this post and if you have any doubts.