
Nestle is one of the world’s leading FMCG company. Most likely, dream company for most of the B-school students too. It has its presence in about 187 countries. Think how many market-segments and strategies it would be catering to! In order to understand their strategies, we have to get to know how BCG matrix of Nestle works.
To serve its immensely heterogenous customers, they maintain a broad brand portfolio, with numerous products under it. And, yet is successfully leading in most of the markets worldwide.
Boston Consulting group’s product portfolio matrix is designed to help with long term strategic planning, to help a business consider growth opportunities. This is done by reviewing its portfolio of products to decide where to invest, to discontinue or develop products.
So, let’s not wait anymore, and start digging!
What is BCG matrix?
BCG matrix isn’t a new phenomenon. And, in the changing digital landscape, we can slurp a lot of information from it. In fact, we can also apply it for developing better marketing strategies.
We will begin with understanding what are the quadrants of this matrix, how to interpret it, and many more things!
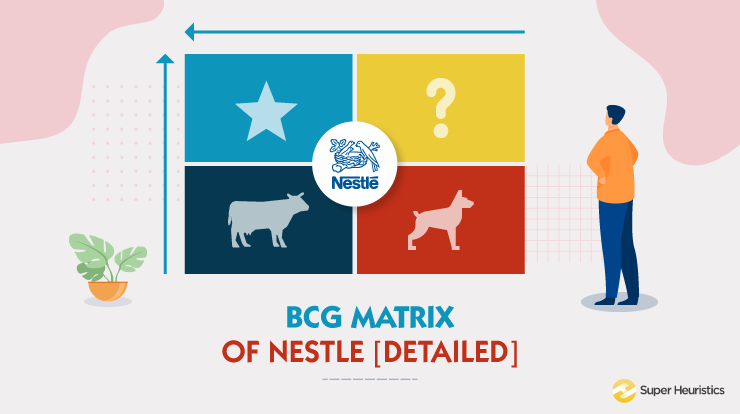
So, the Matrix is divided into 4 quadrants based on an analysis of market growth and relative market share, as shown in the diagram below.

Source: superheuristics.com
This matrix is, put simply, a portfolio management framework that helps companies decide how to prioritize their different businesses. It is a table, split into four quadrants, each with its own unique symbol that represents a certain degree of profitability. Quadrants being- question marks, stars, pets (often represented by a dog), and cash cows.
Now, let’s understand these quadrants better.
Each of the four quadrants represents a specific combination of relative market share, and growth:
Low Growth, High Share: Firms should milk these “cash cows” for cash to reinvest.
High Growth, High Share: Firms must invest in these “stars” as they have high future potential.
High Growth, Low Share: Firms should invest in or discard these “question marks,” depending on their chances of becoming stars.
Low Share, Low Growth: Firms should liquidate, divest, or reposition these “pets.”
Okay, so imagine that you have your matrix. Is your problem solved? No more critical decisions? The answer is “no”. Your task as an MBA is to interpret what the BCG matrix of Nestle shows you.
For instance, “pets” might look like the least attractive product. Will you discard it? Or push it to become cash cow or star later?
Next, we should now start our analysis of BCG matrix of Nestle, India

Marketing Concepts Mastery Course
Learn the essential marketing concepts. Create the best outcomes from MBA without depending on placements!
Understand BCG Matrix, SWOT Analysis, Ansoff Matrix and many other important marketing frameworks just like an expert MBA professional would. Solidify your concepts by building a personal brand in marketing.
BCG Matrix of Nestle India
Here I am taking the case of Nestle, India specifically. Because, I aim at making it easily relatable for you. Now its time to check out the BCG Matrix of Nestlé and what products of the company fall under what Quadrant.
Cash Cows
For Nestle, there are some products those have been undoubtedly the Cash Cows. They are- Nestle’s Maggi Noodles, NesCafe and its popular chocolates like KitKat, Munch.
With a market share of 80-85 %, Maggi Noodles holds a pseudo-monopoly in the market and have a high customer loyalty.
These products need very less investment. In fact, they are already available at every nook and cranny. And loved my most of us!
Stars
In the case of Nestle, Nestle’s Mineral Water and Nestle’s Nescafe Coffee (like Nescafe Latte) fall in the Star quadrant of the BCG Matrix of Nestle.
With the growing number of health-conscious customers, these products have the potential to produce greater ROI later. Even though, it might take heavy investment to make Nestle-brand visible in that market, they may turn to cash-cows pretty soon!

Source: nestlepurelife.com
Question Mark
Now this is an interesting bunch of products!
Nestle Everyday, Nestlé slim and Nestlé Milk maid are some of the milk and milk-based products from the house of Nestlé. And they come under Question Mark category.
This domain needs a higher investment, because its in the phase of development. And it is a high-risk decision to invest in them too. Like for example, “É by Nescafé”! Nestle aims to revolutionize coffee-making with this new smart coffee maker.

Source: enescafe.in
Pets
Products under this category are not expected to bring in any significant capital. So future investment is seen as a wastage by firms, it could be invested in a Question mark or Star category instead.
I believe Nestle Milo and Koko Crunch can be put in this category. They did not have any significant grasp in the market.

Source: Nestle.com
Its time to dig deeper. Let’s see how Nestle “milked” their Cash-Cow Maggi!!
Maggi- Milking the Cash cow!

Source: nestle.in
Do you know how has Nestle uses this as an opportunity?
Let me tell you some sad facts first. Nielsen points out that 85% of all consumer packaged goods (CPG) product launches flop.
Yet, Nestle never steps back from launching new products. And what’s a better way to do that than launching under the safety-net of “Maggi” brand?
Firstly, new variants of existing product lines have more chances of surviving out. Secondly, if gaining popularity then same distribution channels can be used, without extra efforts. And thirdly, analysts have noticed that Nestle doesn’t even feel the need to advertise them.
And lastly, as consumer already love Maggi’s brand, they hardly spend time for purchase decisions.
Now, the next segment is to know what strategy to follow, based on the growth-share matrix??
What Next to do with the Growth-Share Matrix?
We can use this matrix to decide on multiple fronts. Starting from resource allocation to utilization of marketing channels or platforms.
It can help grow a company’s expected ROI per channel. Now, it may vary for different B2B and B2C businesses and even across industry sectors.
For instance, high growth and high returns, investing in organic search (SEO) may be a good choice. At the other end of the scale, we have not witnessed companies growing exponentially and achieving high ROI as a result of Twitter alone.

Source: yewbiz.com
You can apply different strategy according to the quadrant you are in. The above image summaries a generic trend followed in the industry.
For understanding how the resource allocation is decided by firms do read our article on BCG matrix of ITC.
It tells you about how the matrix can help you to understand which resource allocation-strategy to use for which category. The strategies that are used by marketers are- Build, Hold, Harvest and Divest.

Case Analysis Blueprint Course
Use marketing frameworks like these to solve business case studies with ease
Frameworks like the BCG framework are extremely crucial to analyze the most complex case studies. Get to know how to analyze a marketing case study comprehensively in just 5 slides. Which means that the next time you need to analyze a case, you know exactly how to ace the case
Conclusion
We learnt why companies need a BCG matrix and what it is. Why it's such an essential tool for marketers.
We created The BCG Matrix of Nestle, keeping its broad product portfolio in mind. We identified the Matrix's various components, namely- Star, Cash Cow, Question Mark and Dog.

Next, we analysed how Nestle “milked” a cash cow- Maggi. Since Maggi is a well-know brand, hopefully this article provided a lucid clarity on how Nestle benefits from it.
And then we can see how can the matrix be used in order to decide where to invest and what platform to use, according to the quadrant.
Hope this article helped you!


[…] 参考サイト: – BCG Matrix of Nestle [Detailed] – Super Heuristics ( 2021-03-19 ) […]