I had established this in one of my earlier articles and I say it here again. This argument will form the basis of why you would need to learn any of the sales forecasting methods.
If you are someone who aspires to be a marketing strategist or a brand manager then you need to know this.
Sales performance is the responsibility of the brand manager way more than it is of the salesperson out there in the store.
This is true.
The salesperson’s responsibility is customer relations. Whereas it is your responsibility as a marketing manager to stimulate sales.
Now, once you know this it should really transform the way you think about your work. This also means that you need to command a crisp understanding of sales in terms of sale metrics and projections.
Sales forecasting becomes a crucial thing in such a scenario.
And therefore, the objective of this post is to share with you one of the easiest sales forecasting methods that there is.
What do I share within this article?
Through this article, you will get to know one of the easiest sales forecasting methods using MS Excel. Although there isn’t any prerequisite knowledge you need to have, you should consider reading the following posts as a prelude to this one:
Article 1 – How to do (accurate) sales forecasting – using Excel and SPSS
This posts harps on the importance of sales forecasting for you as a marketing manager. It introduces to you the dataset that I have used in Article 2 and this article that you are reading right now.
Article 2 – Linear Regression is inaccurate and misleading! Here’s why
Further, I extend the point of how the knowing just a few things can be dangerous. Which means, that while Linear Regression is the first thing all of us learn in modeling, it often gives us inaccuracy. I show that in Article 2.
Reading these articles will help you understand this one better and faster.
These articles are a part of a series on sales forecasting methods.
The sales data and expenditure dataset that I am using in this is available for download in both the articles I have mentioned above.
Here, I will create a model based on the dataset. This will be a non-linear model (which is pretty much the reason why we discarded Linear Regression and linear model in article 2).
Let’s begin our journey to develop a model while learning one of the easiest sales forecasting methods.
Step 1 – Observe the data
Let’s just sit back and have a look at our small and humble dataset. The dataset has three columns. The data is of 12 quarters and includes the Advertisement Expenditure (column B), Sales Promotion Expenditure (column C) and the Sales (column D).
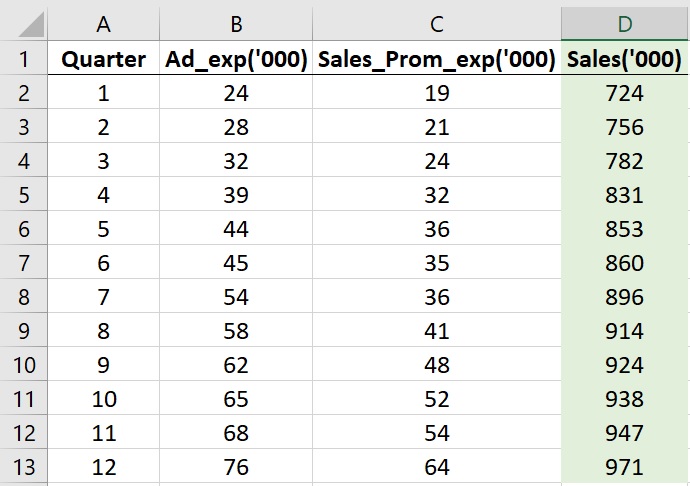
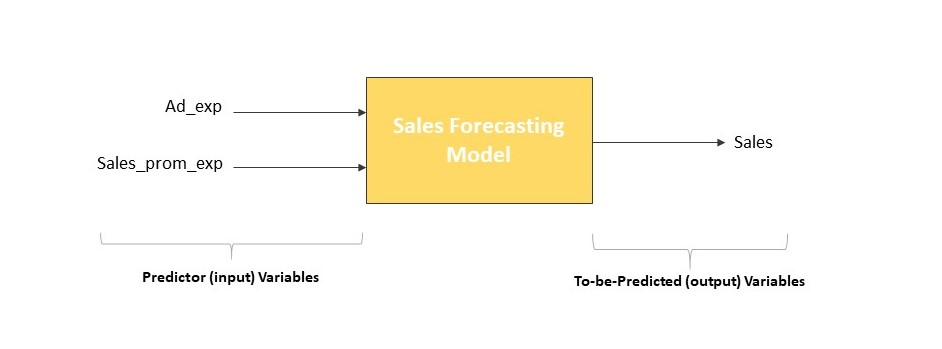
One can understand this intuitively that columns B and C are the predictors (independent) variables. These are your input variables.
Where as column D is the to-be-predicted (dependent) variable. This is your output variable.
Which basically means, if you play around with your Advertisement expenditure and the Sales Promotion Expenditure you are likely to see changes in your Sales. Which is true in real life, isn’t it?
Step 2 – Check if Linear relationship exists
All the relationships aren’t linear. Which means a 10% increment in the advertisement expenditure won’t always lead to an exactly 10% increase in sales.
We learned this lesson the hard way in the article titled ‘Linear Regression is inaccurate and misleading!’.
Therefore, we need to find whether there is a linear relationship between the input and the output variables. And if there is not then what is the nature of the non-linear relationship that exists between:
Ad_Exp and Sales, and between, Sales_Prom_Exp and Sales.
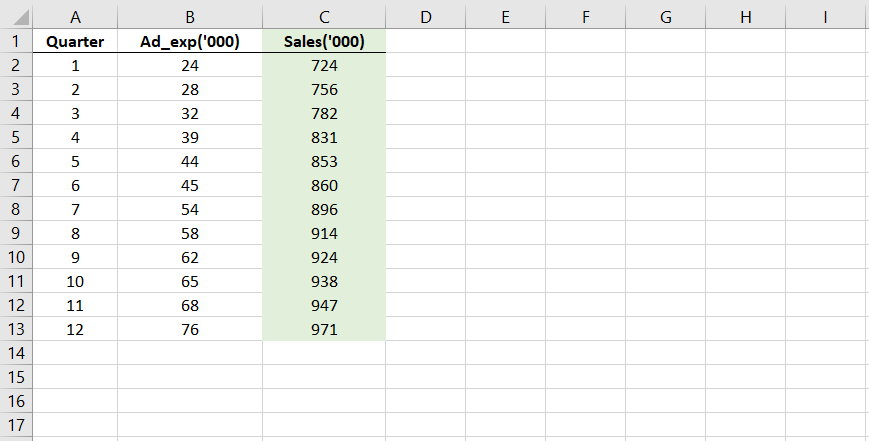
Let’s begin with Ad_Exp and Sales.
I take these two columns and paste them side by side on a separate sheet. Like this.
Now, let’s see the relationship between the two, graphically. I plot them on a scatter plot which is available in Charts in the Insert tab.
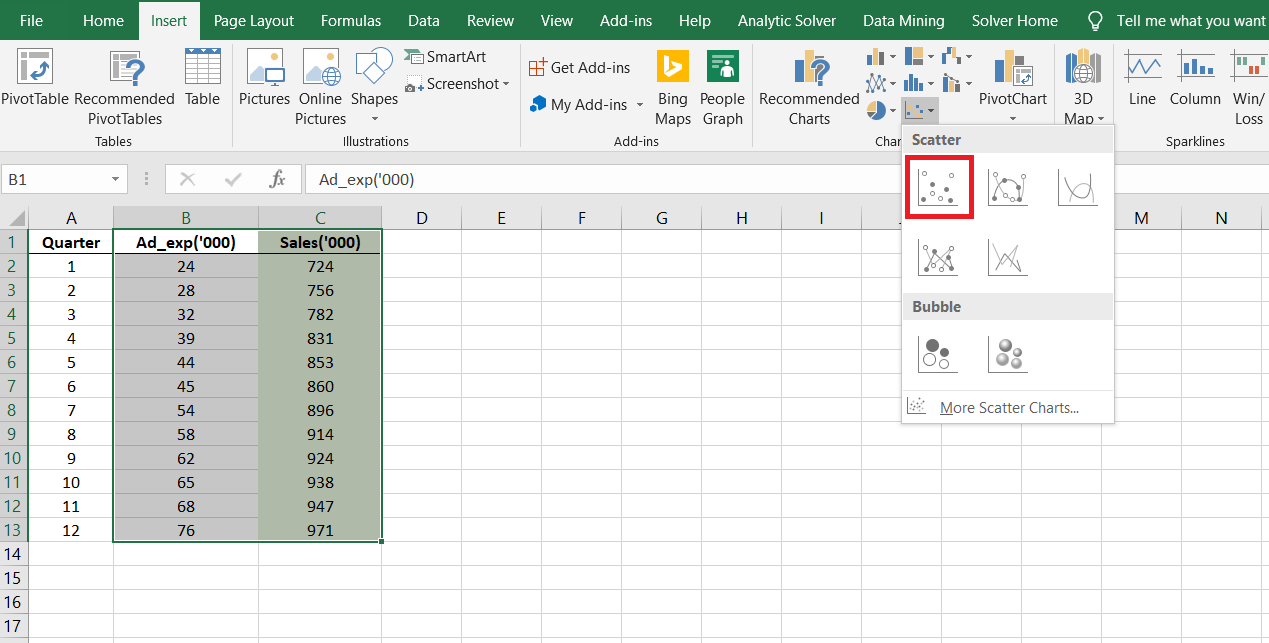
But we need to see which model fits the best. A linear model or any of the many nonlinear models?
Therefore, we add a trendline to the scatter plot like shown in the image below. The trendline makes it easy for us to visualize how the relationship is.
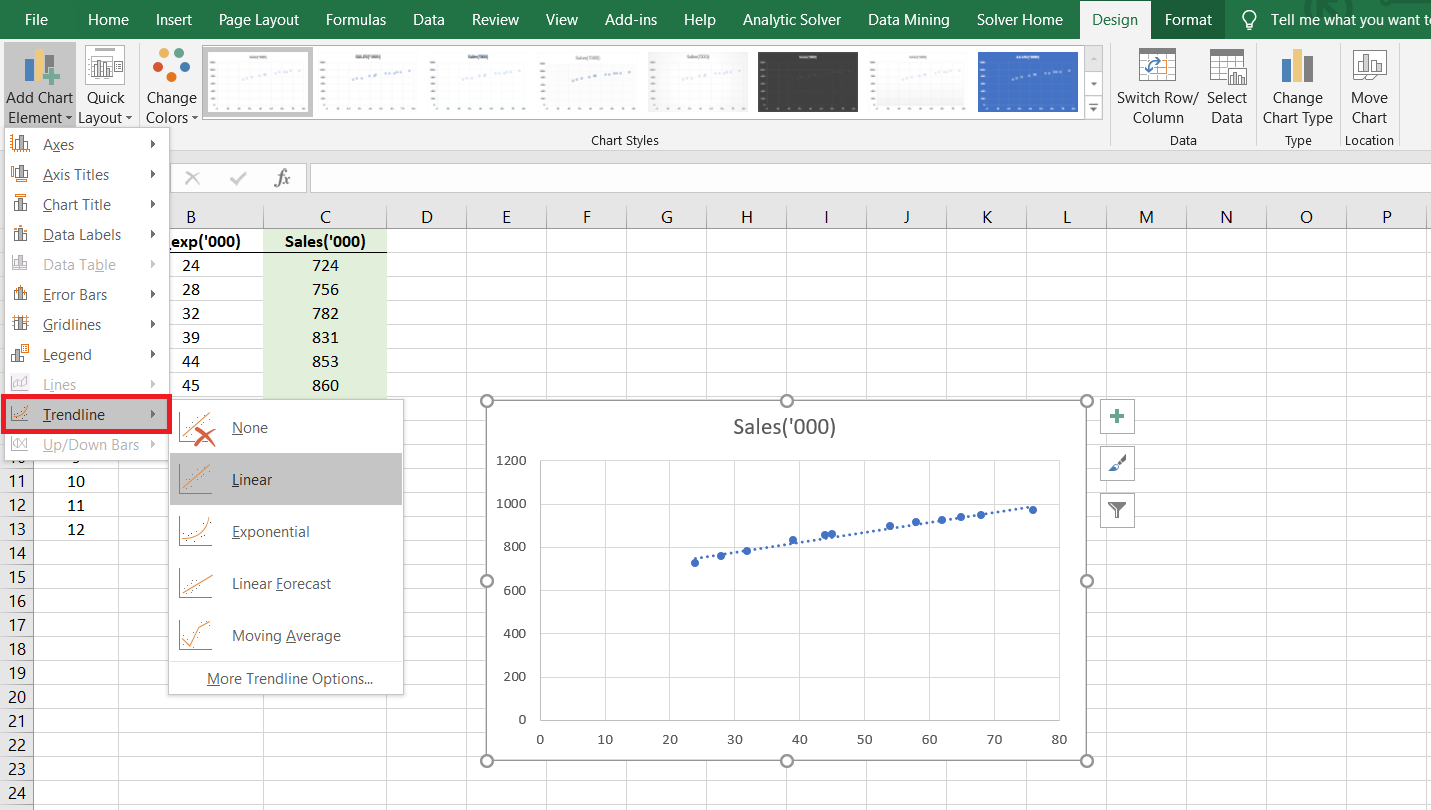
From the settings, ensure that you check the R-squared box. What is R-squared and how to turn it on has been explained in Article-2 elaborately.
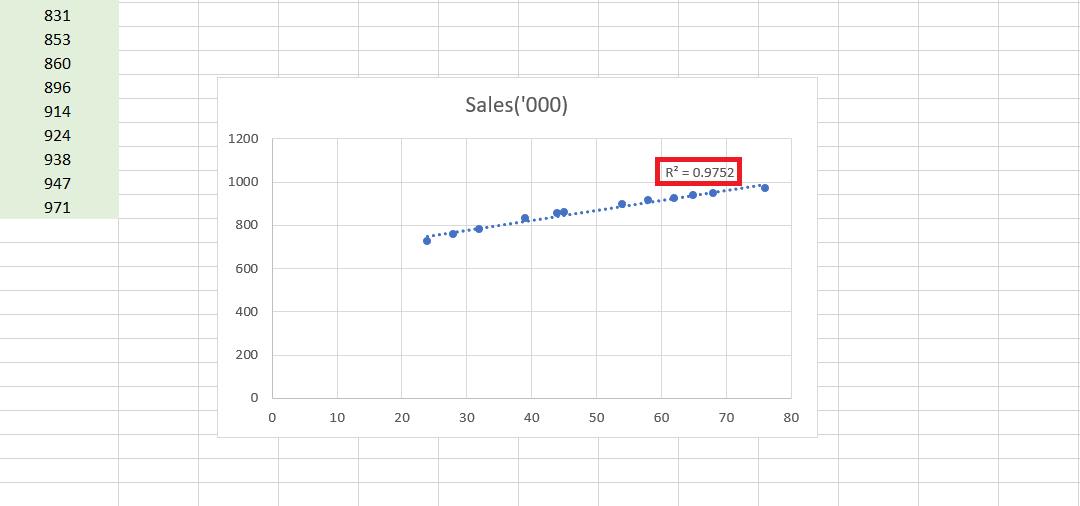
We see that for a Linear model, the R square is 0.9752.
Experience will tell you that a higher value (near about 0.99) can always be found using some model or the other. Therefore, we sort of get a sense that a linear model doesn’t describe the relationship between Ad_Exp and Sales well.
And that we need to check other nonlinear models in search of a higher value of R-squared.
Step 3 – Find the best nonlinear model
Now, if the relationship is not described well by a linear model, it obviously means we need to find a nonlinear model that ‘fits’ the data well.
Usually, you will find that the nonlinear relationship will be best described by any of these four models which Excel offers us:
- Logarithmic Relationship
- Exponential Relationship
- Polynomial Relationship
- Power Relationship
In the Trendline settings, Excel allows us to choose any one of these four trendlines. You need to select and observe each of these trendlines.
Again, make sure that the R-squared box is checked as it will display the R-squared values for each of these four relationships.
I tried all the four relationships and observed their R-squared values. In the image given below, I show you the results of all four types of models.
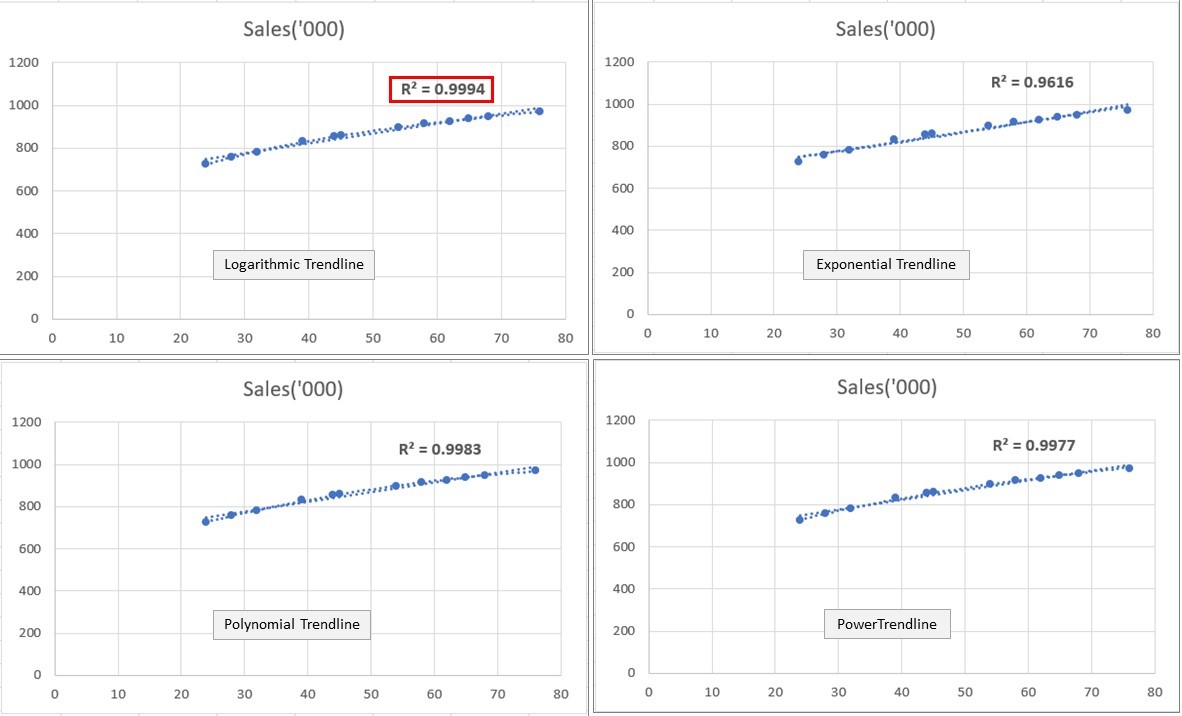
It is clear from here that with the highest R-squared of 0.9994, the Logarithmic model is the clear winner.
This means that the relationship between Ad_exp and Sales in not Linear but Logarithmic in nature.
And therefore, a linear model will not be able to correctly (accurately) justify the relationship between the two.
But, Excel only allows us the option to run Linear Regression. So if we were to use Excel to create our model, how will we account for this logarithmic relationship in the Linear Regression?
We will see this a couple of minutes later.
Before that, let’s repeat the same exercise for the other predictor variable that is Sales_Prom_Exp. I have again lined up both the columns side by side in a new sheet.
Again, we need to plot them on a scatter plot and see the best fitting trendline. I repeated the same exercise as I did for the Ad_exp and Sales pair.
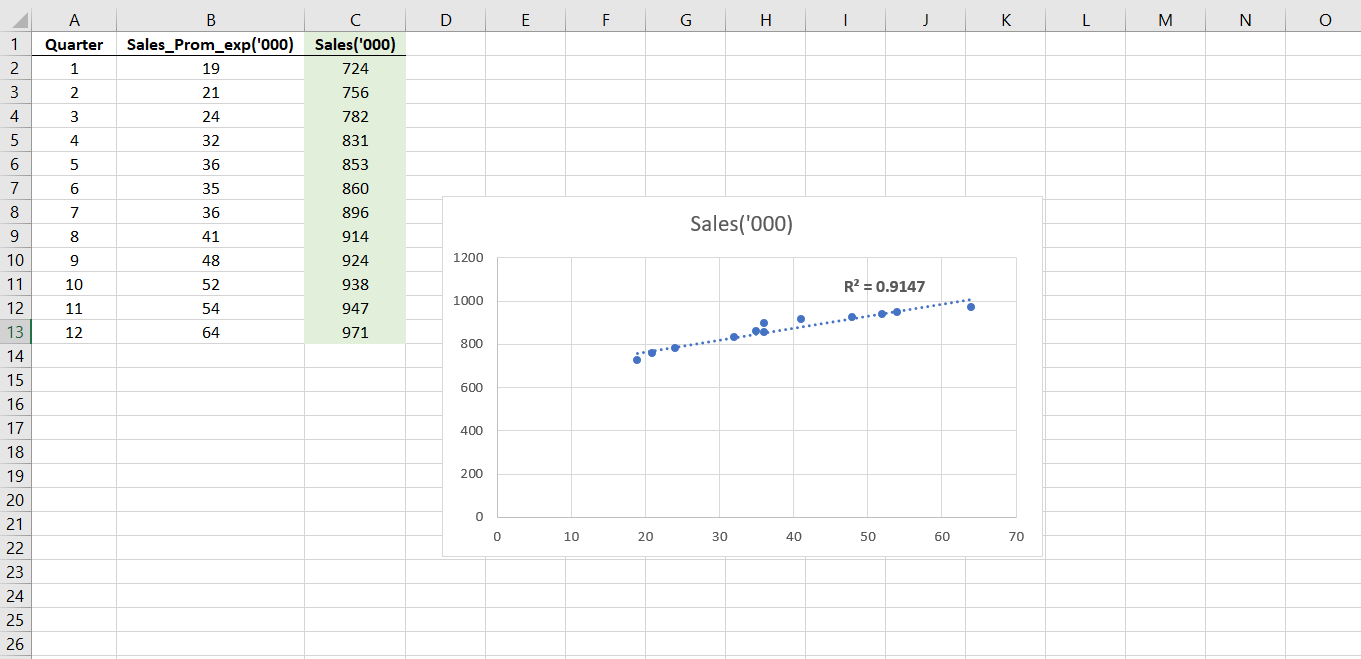
The linear trendlines give us a weak R-squared value of 0.9147. Therefore, I tried the other nonlinear models. I got the following as the trendlines and R-squared for those models.
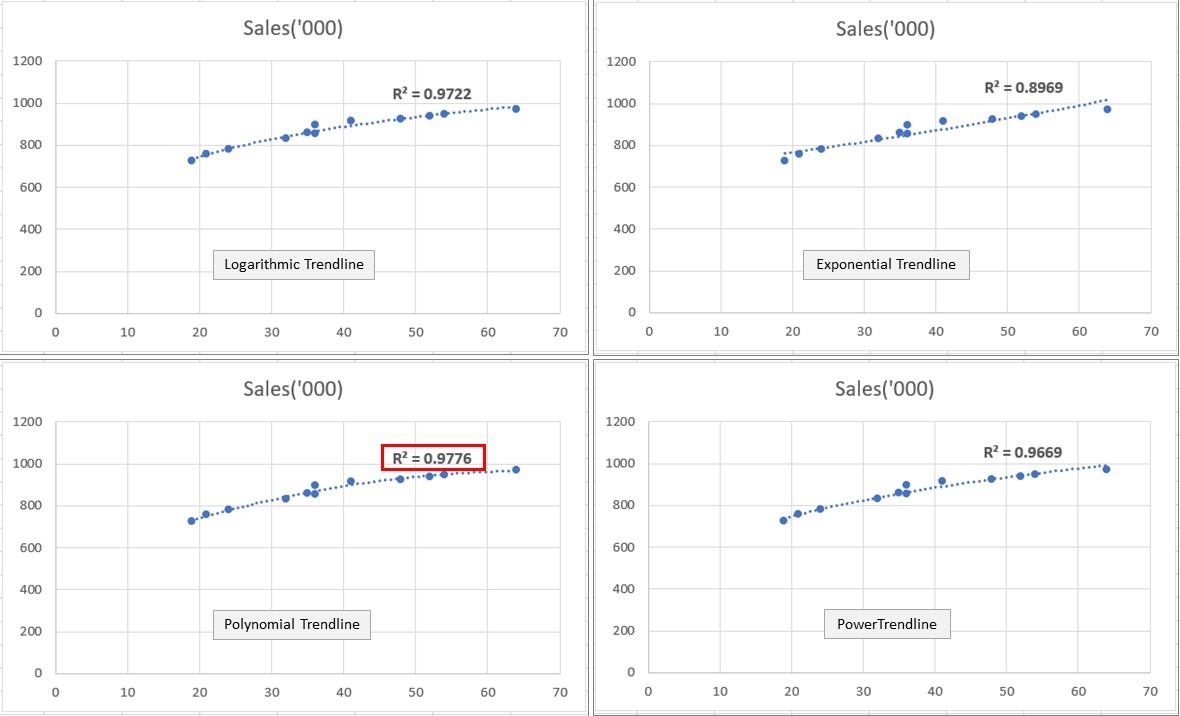
The Polynomial relationship wins hands down with an R-squared value of 0.9776.
Therefore, we know that the relationship between the Sales_Prom_Exp and the Sales can be best described by a polynomial model.
Step 4 – Transforming the predictor variables
We come back to that questions again:
If we were to use Excel to create our model, how will be account for these logarithmic and polynomial relationships in the Linear Regression?
The answer is this – we transform the predictor variables according to the relationships that we have discovered.
This means that if Ad_exp and Sales have a Logarithmic relationship, you will transform the Ad_exp values to its log values.
Similarly, if the Sales_prom_exp and Sales have a Polynomial relationship, you will transform the Sales_prom_exp values to its squared values.
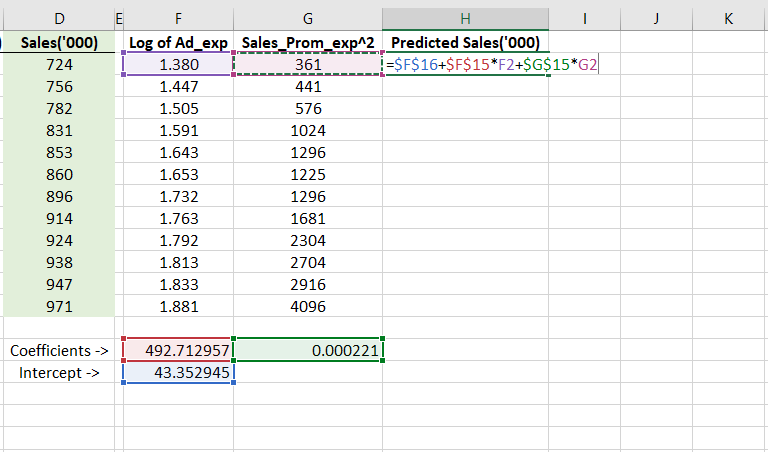
Here’s what we get after transforming the predictor variables.
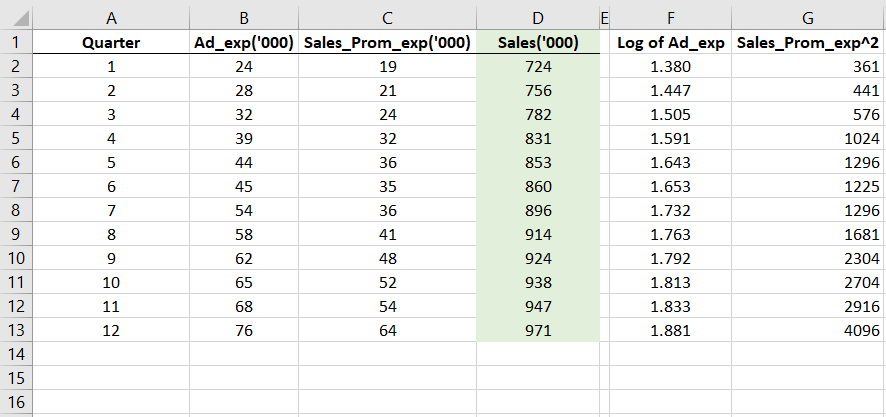
You will see that in column F, I have taken log of the Ad_exp values and in column G I have taken the squared of the Sales_prom_exp values.
Having done this, we are ready to run our normal, linear regression on these transformed predictors and on Sales (column D).
Step 5 – Perform Regression on the transformed variables
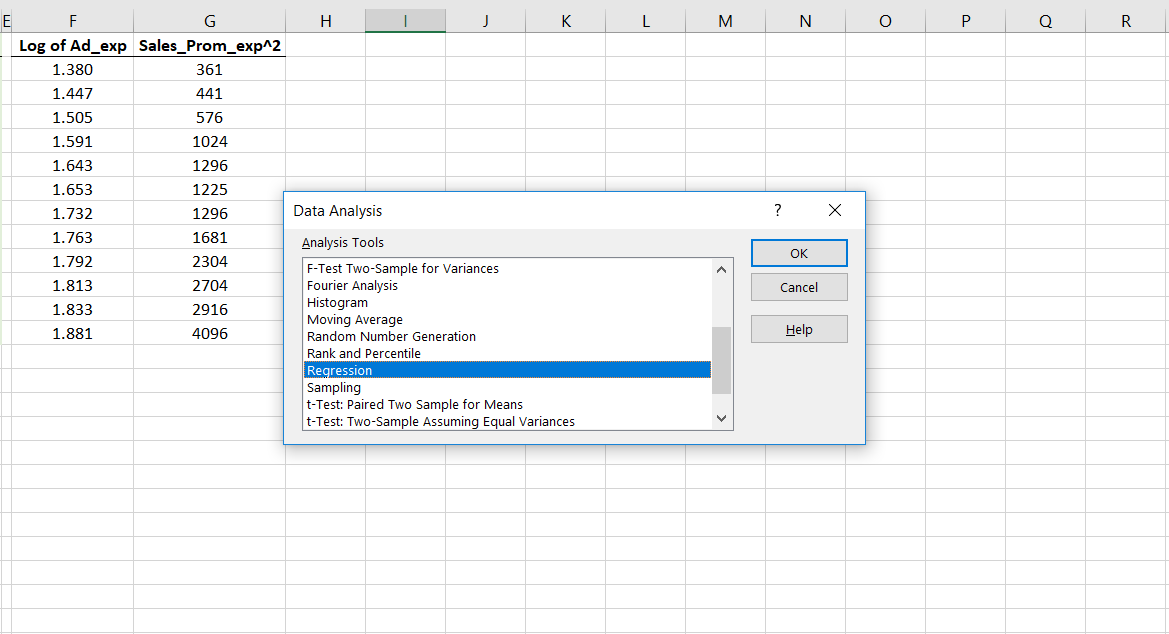
With our transformed predictors and the Sales (output) variable in place, we can proceed for Regression. We do this like we normally perform regression using excel. While I have explained the process elaborately in the Linear Regression article, I will take you through it again, here.
In the Data tab select Data Analysis. From the following window that opens up, choose Regression.
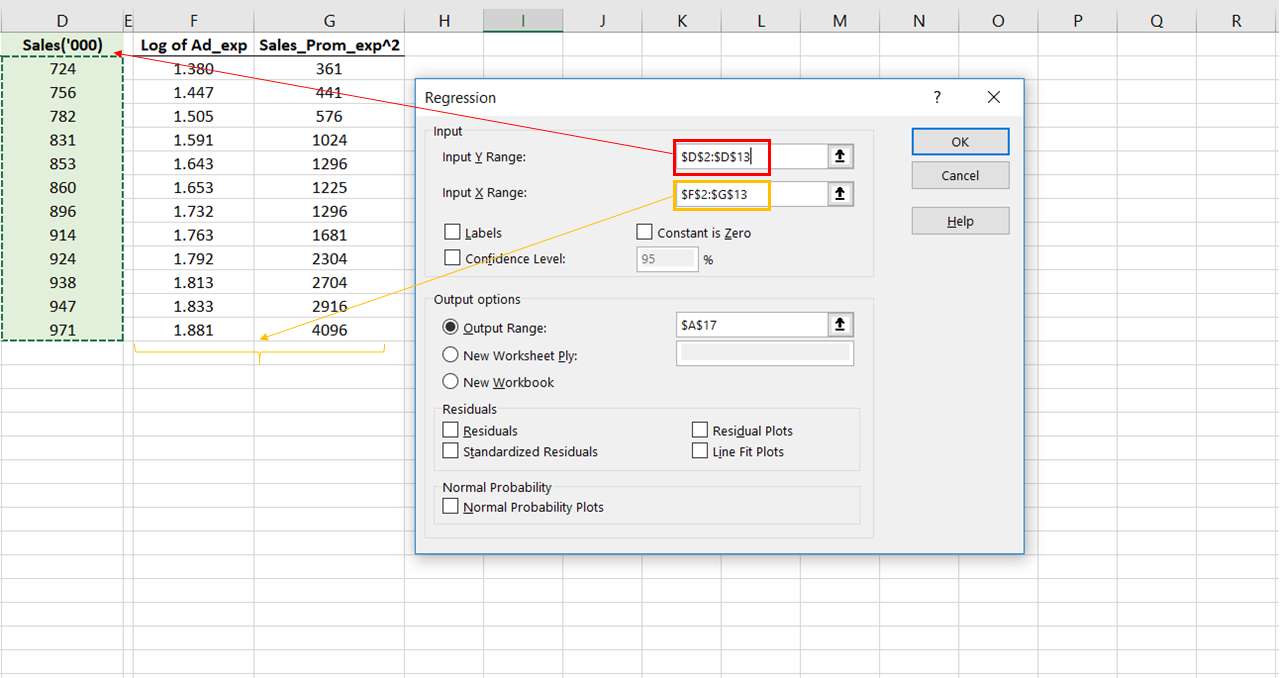
In the Regression window enter the required details. The input Y range is to be filled up with Sales (Y range means the output). Whereas, the input X range is to be filled up with the two predictors.
Choose any empty cell where you want your output to be displayed. This is how the window should look after you have filled it up.
Go on to run this regression. Instantly, the output tables will be displayed on the sheet. The things to observe here are the R-squared and the coefficients.
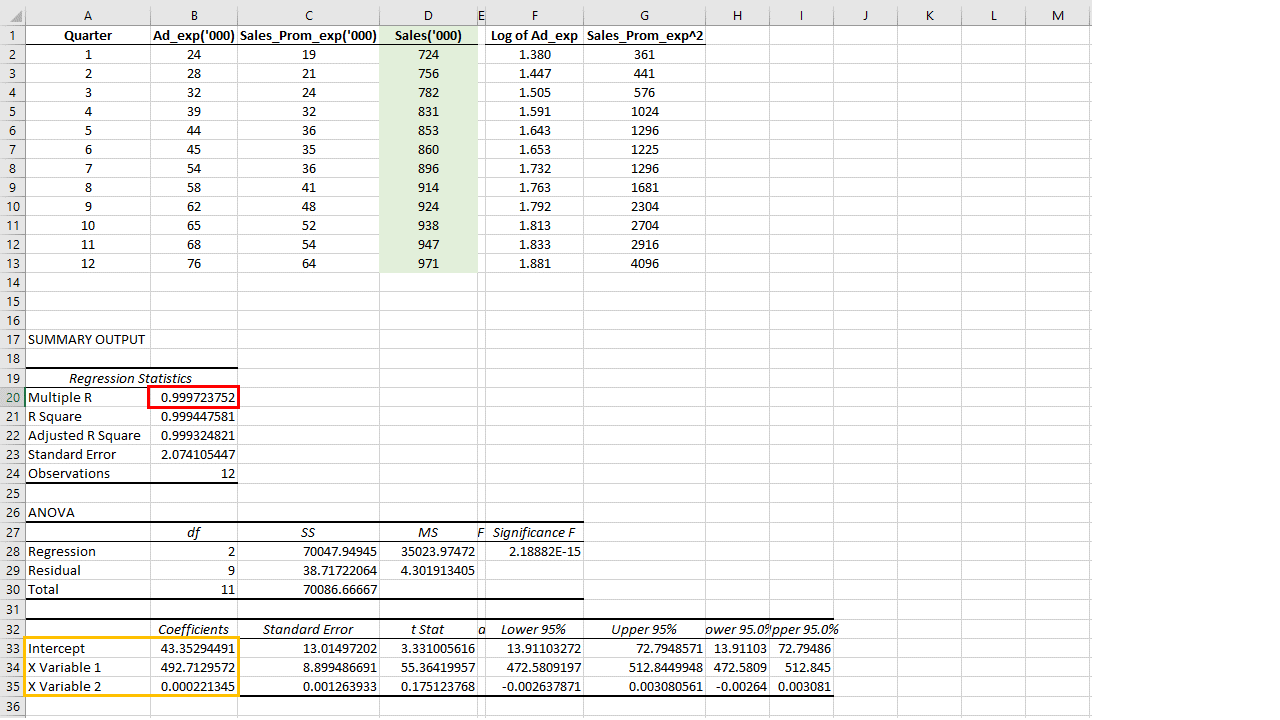
The R-squared is extremely high (0.999723) which gives us the confidence that this model that we will develop using the coefficients given below will be extremely accurate.
I have copied the coefficients and the intercept below the table itself for the convenience of computation.
Please note that 492.72 is the coefficient for the Log of Ad_exp and 0.000221 is the coefficient for the Square of Sales_prom_exp.
(To clearly understand the fundamentals of coefficients and intercepts, read this post now).
Step 6 – Develop the final model equation
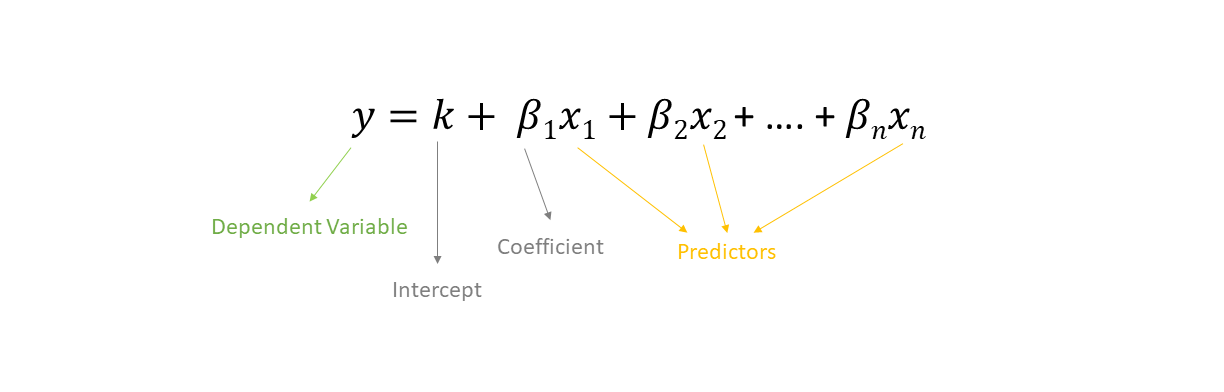
This is the general form of the linear regression equation.
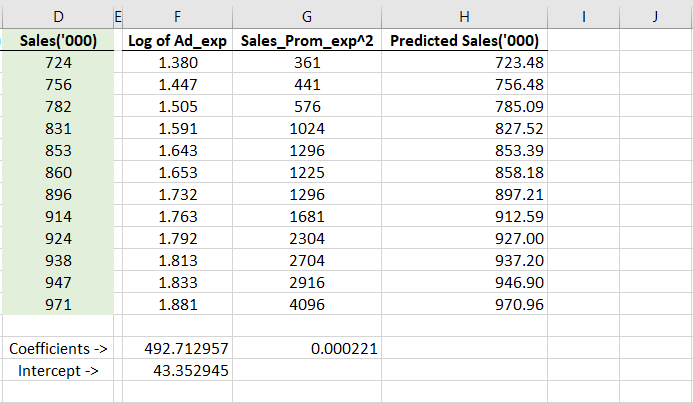
In accordance with this, I applied a formula in the next column. This formula shall be our final model and will give out the predicted sales values for a given set of predictors.
In the form of an equation, we can say that the following expression depicts our sales forecasting model
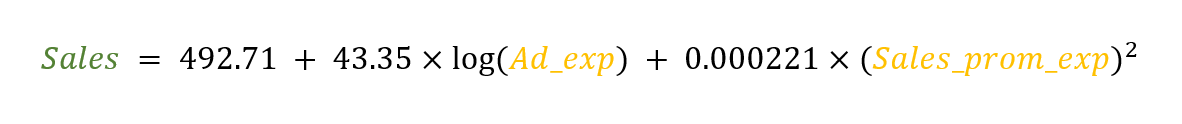
This equation can accurately predict our sales for a given set of predictors.
This is how that formula will look like in excel.
Step 7 – Testing the Model
You can test this model using the predictor values that we already have in our dataset. So, for each of the Ad_exp and Sales_prom_exp values that we have for the 12 quarters, we will apply this formula on them and see how accurately they predict the sales.
The image below shows us a comprehensive comparison of how well a nonlinear model does in comparison with a linear model.
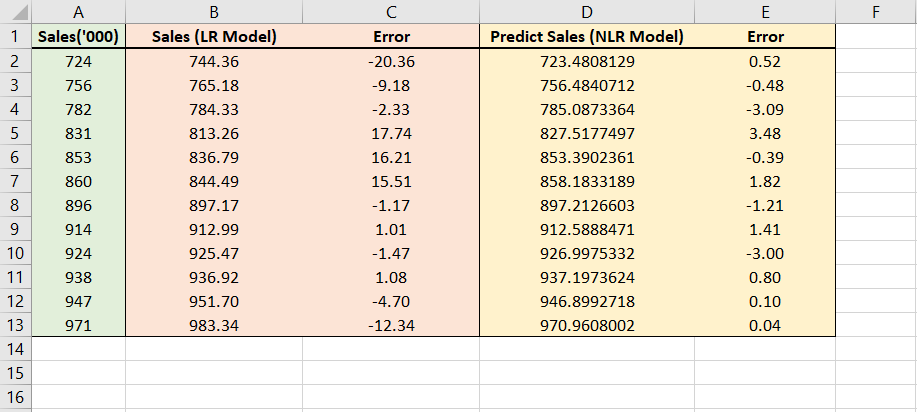
Column A shows us the actual sales value. Column B shows us the predicted values for the linear model that we have developed in the last article.
Similarly, Column D shows the predicted values of the non-linear model we have just now developed.
The interesting thing to compare is the error we get from both these approaches (given in column C and E).
It is clear that this nonlinear model that we have just now created does a better job at giving more accurate sales predictions.
Conclusion
With this entire series of articles, I brought you some of the sales forecasting methods. Knowing this is crucial to doing justice to your role as a marketing manager. If you are in the early days of your business education, practicing this skill will take you a long way in your projects.