
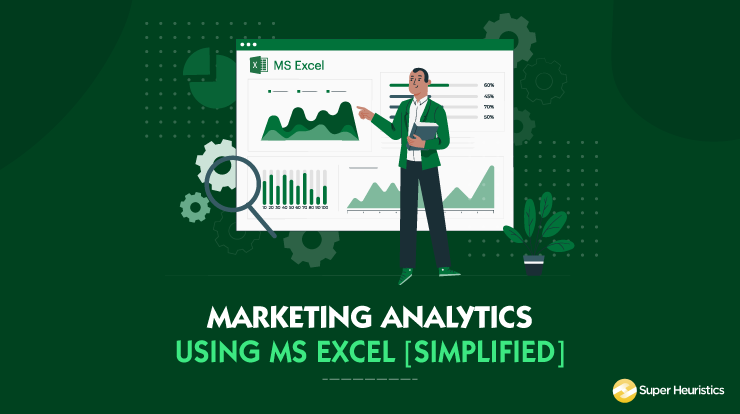
Excel began to be used as a tool to store and structure data. With time it started being used as an application for small data computations. Today, with various upgradations, it is being regarded as an entry point into the world of analytics. Through this article, lets acknowledge the power of this tool and dive into the world of Marketing Analytics using Excel.
The best thing about excel is that we have all used it for minor data manipulations and for the sake of those easy to make charts. So, we are all well aware how easy it is to navigate through excel. But we have not used this multipurpose tool for one of its most important application- Data Analytics.
I will try to acknowledge the power of excel in data analytics through this article.
Why Marketing Analytics Using Excel
The reason for preference of Excel for marketing analytics industry wide is threefold:
Easy to Use: Excel does not involve stringent coding techniques. It has commands that are simple and user friendly which guide you through the process. It is the first step for someone looking to enter the field of analytics.
Range of Application: Excel is one tool capable of storing, sorting, arranging, computing, analyzing and then presenting data in the most lucid manner. This is the reason why it has crossed industries and departments with its utility.
Entry Point to Complex Data Analytics: Learning excel is fundamental for any professional or academic career in data analytics. Its visual, its transparent and it keeps things simple and hence its wide application.

Source: https://www.i-scoop.eu/data-driven-marketing-the-state-benefits-and-drivers-of-data-marketing/
Marketers handle tons of data whether it be related to sales, product pricing, customer feedbacks and other customer insights. All firms are engaging in data driven marketing in order to optimize marketing efforts to the empowered consumer. Analytics is the key to convert this data into information.
Marketing analytics using Excel can be easily done with the varied functionalities of excel in analytics domain. Let’s touch upon those domains and try to get a fair understanding of how to do marketing analytics using excel.
Excel to Summarize Marketing Data
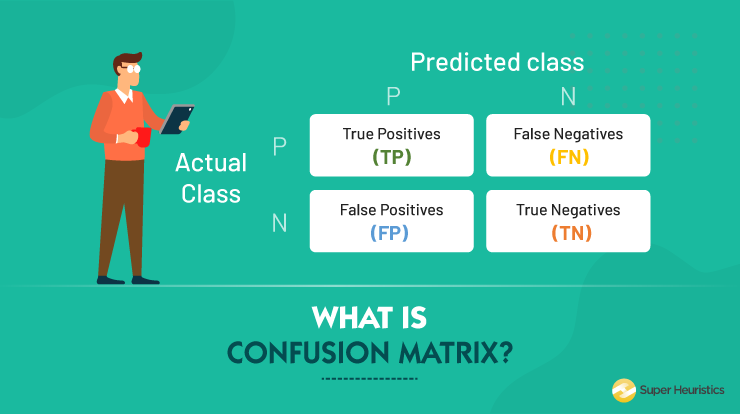
Think of a scenario where you are the Area Sales Manager at a footwear firm. You are to analyze the following:
- Investigate the sales volume and % Sales for every month and for different products.
- Analyze the impact of weekends and festive seasons on your sales volume.
- Study the impact of a marketing promotion on sales.
Do these scenarios seem relevant to you? They should because these are the kinds of analysis most of us would be doing once, we get to our jobs.
The data that is made available is in the form of rows and columns of random numbers and text. It is important to slice and dice this data to gain insights.
Pivot Tables help with summarizing large detailed data set into compressed insights. Not only that, with the help of slicers it is easy to navigate through data by quick filtering. Pivot tables also help in data visualization which makes it easy to study as well as present data.
Do watch this video to get a better understanding of how to use pivot tables to sort and categories data.
Some other important functions that help in data summarization are as follows:
- Counting and Summing Functions: COUNTIF, COUNTIFS, SUMIF, SUMIFS, AVERAGEIF, AVERAGEIFS
- Statistical Functions: AVERAGE, STDEV, RANK, PERCENTILE, PERCENTRANK
- Array Functions: TRANSPOSE, FREQUENCY
This was just the beginning of our discussion about marketing analytics using excel. Next, we move on to more dedicated applications of excel for marketing analytics.
Pricing
Understanding product pricing and how that particular price impacts customer is one of the most important and frequent issues for a marketing manager. In order to do so, marketers should have a fair understanding of the consumer demand curve.
Linear and Power Demand Curves
These curves are used to study the consumers purchase trend with respect to prices keeping the elasticity of the product in mind. Pricing analytics is one important domain of marketing analytics using excel.
Linear Demand curves represent a straight-line relationship between price and demand.
Power Demand curve forms an arc between the price and demand.
Watch this video to understand how to use excel to formulate and analyze linear and power demand curves in price analytics:
Excel Solver to Optimize Price
Excel has some add-in functions that work as readily available tools for complex analysis. One of them is the solver add-in. Often in marketing, we tend to have projects that require us to maximize profits or minimize one or the other thing.
The video below very lucidly helps in solving a typical price optimization problem:
In case the price elasticity for a particular product is not known, then a demand curve for a product can be obtained by identifying the lowest and the highest price obtainable for the product. The lowest, highest and a mid-way price can be used to estimate product demand.
This approach is discussed in the book by Robert Dolan: Power Pricing
Watch this video to get more clarity:
Price Bundling
Until now we have discussed linear pricing models. The customer pays equal amount whenever he makes a purchase of the product. But what happens when the products are bundled together and the price of the bundle is not equal to the summation of prices of individual products.
Why do companies go for product bundling?
For the simple reason which is to motivate the customer to purchase several products and services from the same company. In bundled price, companies try to sell products for a lower price than what would be charged if products would be bought individually.
How to determine that price which is attractive for the customers and is profitable to the company?
The pricing of bundles is based on the assumption of consumer surplus. Consumer surplus is basically the value customer attaches to a product minus the actual cost of the product. The consumer is most likely to choose a product combination that has the highest consumer surplus.
Do watch this video to see how bundling works explained with examples:
The excel solver can be used to get optimal prices of bundles in order to maximize customer satisfaction and company’s profits. Watch this video to see how.
There are various other concepts like Revenue management and price skimming that can be implemented with the help of functionalities of excel.
Let’s move on to some other domains and see the application of marketing analytics using excel.
Forecasting
Often marketers need to establish relationship between different variables. Whether it be the effect of pricing on sales, the impact of advertisements on product demand or how is allocation of a particular shelf space related to sale of that product.
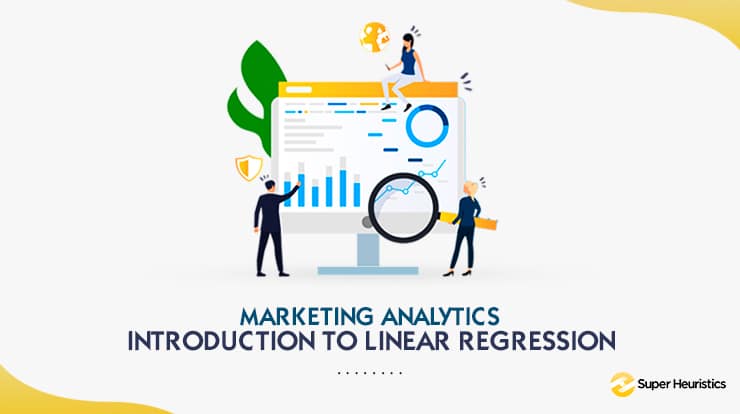
Linear and Multiple regression models are used to help forecast the impacts of such variables. Regression models can be run with the Data Analysis add-in in excel. This is one important applications of marketing analytics using excel.
Do watch the video below to get an idea about how Linear regression analysis is done using Data Analysis add-in:
Analysis of What Customer Wants
Marketing analysts more often than not have to figure out what aspect of a particular product are more appealing to customer and which ones are least.
Think of a scenario where two similar products from two different brands are seeing a varied response from the customer.
Conjoint Analysis
Conjoint analysis helps in determining which product attributes drives sales for a particular product. What are the factors that influence sales of apparels in a showroom?
- Is it the price of the clothes?
- Is it the look and feel?
- Is it the promotional discounts?
- Is it the personal assistance provided by sales team in the show room?
Conjoint analysis is done by listing the various product options available and then weighing them based on listed attributes. The consumer is asked for their preference of particular product attributes and rank them in order.
After the data is gathered, regression analysis can be used to highlight the importance of product attributes. This is another great representation of marketing analytics using excel.
Go through this video to understand more about Conjoint analysis:
Estimating Customer Value
If a company keeps on spending more to acquire customers than the value customers generate, then such companies will struggle to remain in business. Here it becomes important to analyze customer lifetime value and use these calculations to drive profit for the company.
Watch this video to know how customer lifetime value can be calculated for a business:
Monte Carlo Simulation
Monte Carlo simulation is used when the profitability is to be calculated for outcomes in a process that is unpredictable due to intervention of random variables.
Think of yourself as the marketing manager or a product manager of a firm. You are looking to introduce a new product in the market and are looking to estimate the ideal profits from the product. There are various random variables involved namely the market scenario that will determine the price of the product and its sales and unit cost. In such scenarios, Monte Carlo simulation leads the way.
I know I am asking a lot when I ask you to watch this video which is 50 minutes in duration. But believe me it will be worth it.
I would also recommend you to watch and practice the below simulation of marketing analytics using excel:
Optimizing Retention and Acquisition Spending
Firms generally have two ways in which they can increase their revenues. They can either go for retaining their existing customers which comes at a cost or work on acquiring new customers which again has an associated cost.
It is the balance of the two that firms generally want to achieve.
Excel solver can be effectively used to solve such problems and reach at a conclusive solution.
You can enroll this course by Coursera to learn the application of forecasting models in Marketing decisions:
Retailing
The billing desk at a retail shop is an epicenter of truckloads of data that can be used to gain useful customer insights. This data if used properly can drive growth for a particular business. This is yet another application of marketing analytics using excel.
Marketing research studies have found that customers usually buy pairs or sets of some products together. This insight can be used to place these two products close to each other to increase total store sales.
Market Basket Analysis using Excel
Market basket refers to the list of products a customer purchases on a visit to a retail store. There are useful insights that can be drawn from a customer’s basket.
For e.g.; Most customer, when they are buying a torch, will also buy batteries because the torch batteries may die anytime and for such situations the customer wants to keep themselves stocked.
Lift is the most widely used tool for market basket analysis. Lift for two products purchased together is calculated by the formula:
= (Actual no. of times the combination occurs)/ (Predicted no. of times combination occurs if items were purchased independently)
Let’s say for instance lift is to be calculated for a combination of bread and eggs brought together.
Let’s say the actual no. of transactions where eggs and bread were purchased together are 200. There is total 1000 transactions from the store where the no. of times egg was purchased is 300 and the fraction of times bread was purchased is 600.
Fraction of times eggs were purchased= 300/1000= 0.3
Fraction of times bread was purchased= 600/1000= 0.6
Lift for a combination of bread and eggs= 200/ (1000*0.3*0.6) = 200/180= 1.11
Lift much greater than 1 indicate a tendency of customers for items to buy these items simultaneously.
Multiple two-way and three-way combinations can be analyzed for a store with the help of functionalities of excel.
The lift concept can be used to optimize store layouts as it can suggest various product combinations that have a higher tendency to be bought together in order to increase store sales.
These are some of the many applications of excel in marketing analytics. I hope you have a fair idea by now that how vital it is to learn this fundamental tool in order to step into the world of marketing analytics.
I have a few suggestions of marketing analytics books which may help to you to get a fair understanding of all these concepts in detail with a huge resource for practice problems:
Do go through this course on marketing analytics using excel by datacamp.
There are other courses on datacamp which can be done as a sequel to the marketing analytics course using excel such as:
With all this we must realize that the marketing landscape is changing frequently with the increased adoption of digital technologies. But its all for good as digital media enables more data to be captured and monitored real-time.
Let’s understand some aspects of how analytics is evolving in the digital scenario.
Digital Marketing Analytics
Digital analytics is the study of various forms of business data in order to improve the online experience of a business for its customer.
Web analytics has been in the industry for a quite a long time which helps in understanding website data. But with other forms of digital media gaining momentum like search, e-mails, social media, etc. it evolved into digital analytics.
Custom Dashboards
It is possible and recommended to create customized dashboards for your businesses’ applications. These can include customized conversion events and KPIs that can help analyze user behavior on your website.
Content Analytics
Content is the king in todays world. In such a case it becomes imperative to understand what content is working for which kind of customer and then formulating your content strategy.
There are 7 basic metrics that any business would want to analyze to measure the success of their content strategy:
- Audience Size
- No. of repeat visitors
- Time spent on site
- Pages viewed per visit
- Individual web page traffic
- Traffic Sources (Social Media, google search)
- Geo Metrics (Location)
Tools like Matomo and SqueezeCMM help to build and store your content database that will help you to improve your ROI of content.
SEO tools like SEMRush and Ahrefs help with deciding your content strategy based on powerful keywords and then analyze the performance of your page.
Mobile Analytics
Mobile analytics focusses on measuring user interaction with the app along with the app metrics itself like no. of app installs, user retention, app versions and more.
Take a quick look below on some of the parameters that are tracked on the app.

Source: https://count.ly/what-is-mobile-analytics
Google analytics is a free tool that works well for in-app data analysis. The premium version gives more detailed insights.
Some other platforms like Localytics provide useful insights about user-app interaction and this tool is priced according to the data volume generated.
Social Media Listening
Social listening refers to analyzing conversations and trends that are happening not just around your brand but also around the industry that you operate in. Social listening helps on various fronts out of which some have been listed below:
- Brand Health: Gauging customer perception of your brand
- Industry Insights: Analyzing discussion or hashtags within an industry
- Campaign success: How a campaign is resonating with the customers
Tools like Sproutsocial’s Smart Inbox can help you capture more and more conversations that are relevant to your brand or industry.
These are some of the many strategies and tools that are available today to analyze your customer’s digital presence and journey.
I guess by now you must have got a fair understanding of marketing analytics using excel and how the analytics landscape is changing with the adoption of digital media.
Conclusion
- Organizations are flooded with data about consumer choices. Marketing analytics is the interpretation of this data to gather useful insights that help to increase customer satisfaction and ROI of every marketing decision
- Data analysis using Excel with its wide range of functionalities and solver options can enable marketers to formulate answers to key decisions in marketing -Pricing, Ad spend, shelf space allocation, consumer behavior
- Digital marketing analytics help translate customer behavior on digital media into useful insights.

How do I get the access to the datasets used for the analysis?