Confusion matrix is a very popular measure used while solving classification problems. It can be applied to binary classification as well as for multi-class classification problems. It basically helps you to visually analyze how your model is performing.
In reality, it isn’t that confusing. Further, once you know what is confusion matrix, you can derive so many insights from your model. And use it for building excellent marketing campaigns or product launches or enhancing operations, and many more.
Here, I intend to break it into two folds- Machine-Learning and Business interpretations.
We will learn what those numbers mean to an analyst, and what should you as an MBA find in it!
Without further ado, lets jump to our article.
What is Confusion Matrix?
Confusion matrix is also known as “error-matrix”. It is the most commonly used option to report the outcome of your model of N-class classification problem
Classification problem is a task that requires the use of machine learning algorithms that learn how to assign a class label to examples from the problem domain.
An easy to understand example is classifying emails as “spam” or “not spam.”
When we get our data, we start with data cleaning, pre-processing and wrangling. Our motto becomes to feed it to an excellent model and of course, get the classifications done.
But wait a second! How will we know the model is working fine? How to quantify its effectiveness? This is where confusion matrix comes in handy.
We will begin with the technical doubts you may have, like-
1- How is this matrix made?
2- What is 2-class classification problem? (Can more target class be shown in confusion matrix)
(By 2-class, I mean here that you have just two discrete categories. For example, your product is either defective or not, there is no other category)
3- What are the performance metrics?
And some more queries maybe.
How is a Confusion Matrix Made?
Best way to understand anything is to dissect it & know what components make it.
So, what is confusion matrix? By now we know it is error-matrix. And there are different kinds of errors. Some might matter to your business, some might not.
As an MBA, this part becomes critical. Because an analyst would not know which errors to fix. I know, you must be thinking, why not to fix all errors? But most of the times, that isn’t technologically or financially feasible. There is usually some kind of trade-off between these errors.
I will discuss later, how you categorize these errors and prioritize them .
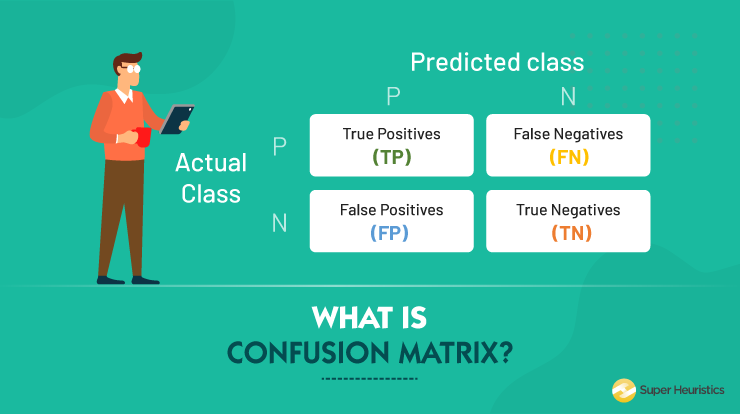
Now going to the matrix parts, basically, this matrix has 4 divisions (may have more depending on your target class).These 4 divisions are True Positives(TP), True Negatives(TN), False Positives (FP) and False Negatives (FN). For example, let’s take a simple cat-dog example:
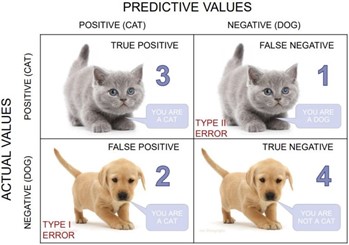
Source - Cat-Dog Confusion Matrix
True Positive: You predicted positive and it’s true. You predicted that an animal is a cat and it actually is.
True Negative: You predicted negative and it’s true. You predicted that animal is not a cat and it actually is not (it’s a dog).
False Positive (Type 1 Error): You predicted positive and it’s false. You predicted that animal is a cat but it actually is not (it’s a dog).
False Negative (Type 2 Error): You predicted negative and it’s false. You predicted that animal is not a cat but it actually is.
These terms make the confusion matrix. Now you must be thinking if the matrix is 3x3, or more than that how will we interpret those? Because real business problems are not going to be this easy, right?
So, lets see how we approach 2 or more- class classification problem.
What is N-class Classification Problem?
Let’s take it up a notch now and understand a relatively complex version of our confusion matrix. Because in a real life problem, you might have to categorize your observations into more than just 2 classes!
First, let’s start with building the simplest confusion matrix- 2-class classification matrix.
I have taken a small output table for us to get started.

P.S: The probability threshold is what decides which category should your observation should be. It is not mandatory to be 50% all the time. Like in this case, we decided the output threshold will be 0.6. Hence when “y pred” value crosses 0.6 value, it is labelled as class-1.
Don’t be scared of these big words. These words mean the same as you know it, but maybe in a slightly different context.
The decision for converting a predicted probability or scoring into a class label is governed by a parameter called “decision threshold,” “discrimination threshold,” or simply the “threshold.” The default value for the threshold is 0.5 for normalized predicted probabilities or scores in the range between 0 or 1.
Example - On a binary classification problem with class labels 0 and 1, normalized predicted probabilities and a threshold of 0.5, then values less than the threshold of 0.5 are assigned to class 0 and values greater than or equal to 0.5 are assigned to class 1.
Prediction < 0.5 = Class 0
Prediction >= 0.5 = Class 1
So, threshold values are nothing but boundary-values for class division.
As an MBA, this part is crucial ! You will be the one doing marketing research and deciding what threshold value matches the industry standard.
Second, now we should compare the actual value and the generated output. And put it into TP, TN, FP and FN values.
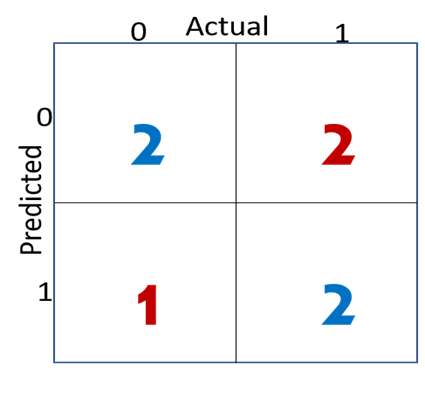
Example for a NxN Matrix (N>3)
A little task for you. So now you can see the matrix, you know the terms’ definitions- figure out which ones are TP, TN, FP and FN.
And when it come to a case, where there are 3 or more discrete categories, you do the following.
1- Firstly, choose threshold values to create multiple ranges
2- Secondly, make a NxN matrix following the above method
3- Evaluate the model performance
A little example of how NxN matrix looks:

Once your model is in place and producing outputs, your work as an MBA has just started. This is when you start “evaluating your model”.
How is that done? Ok, I will tell you.
So once your data-analyst team builds your model, you don’t directly use it on new data to predict or forecast results. You first divide your dataset into two parts- test and train. As their names suggest, you will train your model on one, and test it on another.
Now there you will get columns with actual value (the real value registered) and the generated output (the one which your model has produced). Comparing these values is how you evaluate your model.
And further you gauge the efficiency at different fronts by understanding your performances metrics. And here is it.
What are the Performance Metrics?
You have your confusion matrix with you now. But what does that tell you?
You can roughly see how is the model working. But for a deeper insight, you need to understand some more performance-evaluating metrics.
We will be discussing some of the basic metrics here.
- Recall - Out of all the positive classes, how much we predicted correctly. It should be high as possible.
- Precision - Out of all the positive classes we have predicted correctly, how many are actually positive.
- Accuracy - Out of all the classes, how much we predicted correctly, which will be, in our example case is 4/7. It should be high as possible.
- F-measure - It is difficult to compare two models with low precision and high recall or vice versa. So, to make them comparable, we use F-Score.
It uses Harmonic Mean in place of Arithmetic Mean by punishing the extreme values more. Thus, we get a good measure to compare the impact of recall and precision together!
Now there are even more advanced metrics, like AUC, ROC Curve etc etc.
Watch the following video to get a hang of it!
Now coming to the more interesting part?
By now you know what is confusion matrix, but don’t know what should an MBA do with it.
Answer to that is in the next paragraph!
Why do MBAs Need to Learn This?
Now you have established what all mistakes your model is making. In real life scenarios you would not be able to fix all your errors. Then what do you do? What is confusion matrix used for by an MBA?
You as an MBA, has to analyze which kind of mistakes can you tolerate and to which extent. In general there are two kinds of error- Type-I and Type-II. Let’s read to understand how errors impact the business.
What are Different Types of Errors?
Here we are going to take a famous example of pregnancy test result.
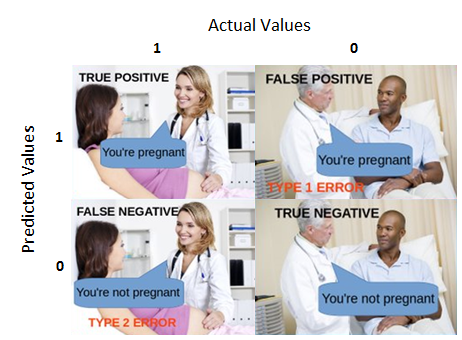
So, see here if you make type-I error (tell a man that he is pregnant)- it is less harmful. Because what’s the worst could happen? The patient will consider other doctor!
But if you made type-II error here, and tell a pregnant woman that she isn’t, that might be harmful. She might not take proper care and medicines. May hamper the baby’s growth.
Similar example is that of loan default prediction. For a bank, its okay if they don’t lend money to someone who might not have been a “bad” customer. That person can apply later again, and might get a loan then. Or even get a loan somewhere else!
But if you classify a “bad” customer as a “good” one, then the bank’s money will be lost!
This is where business-school graduates take the lead. You have to do proper market research and decide which errors to fix? And set reasonable expectations from your data science team.
To learn how to do market research: 5 Secondary Market Research Tools and Techniques
Now, you have figured out how to interpret numbers. But now as a MBA student, you might be the one who has to present the solution to the client/ business stakeholders.
And they would not want to listen to numbers and matrixes. What is expected of you is that you turn these numbers to money-value. Imply a sense to them, in terms of financial terms.
This is called “Cost-Benefit Analysis”.
What is Cost-Benefit Analysis?
Before implementing any tech-related initiative, you must answer many whys and hows:
What might be the impact of this solution? How do we know which tech stack is optimal for solving this problem? Can we afford this experiment? What is the predicted payback period?
Answers to such questions help companies decide whether building a certain solution is worth the effort.
If you want to have an exhaustive view of how to approach ROI Calculation in machine learning models, do read this:
How to calculate ROIs for Machine-Learning Models
Firstly, what’s benefit?
It’s the benefit your model is bringing. For example, if your model correctly flags 80% of the “bad” customers (loan default prediction example). Then you will be preventing loss caused due to lending them certain amount of money.
That money is a part of your benefit!!
Secondly, how to quantify cost?
You can think of cost-bearing parts of a project: Team Size, Tools Used, Taxes, etc.
But what will make your analysis stand out? The calculation of “opportunity cost”. The money you are losing because of the errors made by your classification model.
Cost-Benefit analysis is actually visualized in terms of graphs. You have to plot these across various probability threshold values. This is one of the ways how a firm decides which value to accept for their classification model.
Because if you think, you can identify an acceptable range considering the industry standard. But your model will need a particular value to function.
For example, your graph might look like this:
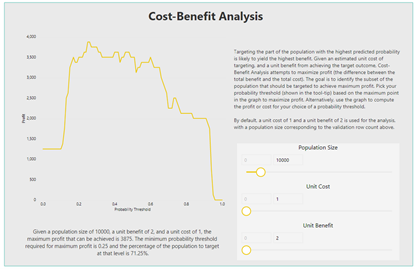
This is how your stakeholders will be able to understand how good is your model!
Conclusion
We also saw how to analyze which errors are to be fixed on priority. And also saw how to convert these values to business terms. Making it easily consumable by client, who would want a financial aspect of the impact.